Publications tagged "rs"
-
 J. C. Revenga, S. Oehmcke, M. Gharun, F. Sutter, F. Gieseke, K. Trepekli, N. Buchmann, and A. DammEcological Solutions and Evidence 2026
Abstract Forest structure, tree diameter, and above-ground biomass (AGB) are central variables in trait-based ecology and forest management, and recent advances in Unmanned Aerial Vehicle (UAV) and LiDAR surveys have substantially improved tree-level phenotyping of these attributes. Building on these developments, machine learning (ML) applications are increasingly used to refine tree diameter estimates and, by extension, improve AGB predictions derived from allometric relationships. Here, we evaluated the capacity of shallow learning methods to leverage local contextual information surrounding a tree of interest to improve predictions of stem diameter and tree-level AGB over 33 ha of a Norway spruce forest (Davos, CH). Our objectives were to (i) characterize gradients of tree height, (ii) examine group-level morphology of tree assemblages as an indicator of forest structural organization and (iii) assess whether these patterns can be leveraged to improve tree diameter and AGB predictions. We segmented the LiDAR point cloud scene into individual canopies and focused on LiDAR-derived tree canopy features. We then used local indicators of spatial association of tree heights to characterize local context and identify tree assemblages within the forest. Assemblage-level metrics were first analysed to characterize forest spatial structure and ecological similarity, and subsequently evaluated as additional predictors in ML regression experiments for tree diameter. Performance was compared between twin regression methods that either incorporated assemblage metrics (i.e. context-aware) or did not. Improvements provided by context awareness were assessed in terms of accuracy gained in estimating tree diameter and AGB. We evaluated three shallow learning methods using nested cross-validation and considered two datasets from the same site: one spatially sparse, based on scattered sampling plots, and one spatially continuous. In both sparse and continuous datasets, we found enhanced prediction performance in context-aware regressions, with RMSE for tree diameter estimation reduced by 4.1% and 0.8%, respectively, suggesting that heterogeneous local context supports improved estimates. Practical implication: Gradients of tree height can reflect underlying ecological drivers of forest structure, and this structural information may be leveraged to enhance predictions of tree diameter and AGB. The proposed method is fully native to UAV LiDAR data.
-
 K. Schrödter, J. Stenkamp, N. Herrmann, and F. GiesekeCPAL26 Third Conference on Parsimony and Learning (CPAL) 2026
The growing demand for machine learning applications in the context of the Internet of Things calls for new approaches to optimize the use of limited compute and memory resources. Despite significant progress that has been made w.r.t. reducing model sizes and improving efficiency, many applications still require remote servers to provide the required resources. However, such approaches rely on transmitting data from edge devices to remote servers, which may not always be feasible due to bandwidth, latency, or energy constraints. We propose a task-specific, trainable feature quantization layer that compresses the input features of a neural network. This can significantly reduce the amount of data that needs to be transferred from the device to a remote server. In particular, the layer allows each input feature to be quantized to a user-defined number of bits, enabling a simple on-device compression at the time of data collection. The layer is designed to approximate step functions with sigmoids, enabling trainable quantization thresholds. By concatenating outputs from multiple sigmoids, introduced as bitwise soft quantization, it achieves trainable quantized values when integrated with a neural network. We compare our method to full-precision inference as well as to several quantization baselines. Experiments show that our approach outperforms standard quantization methods, while maintaining accuracy levels close to those of full-precision models. In particular, depending on the dataset at hand, compression factors of to can be achieved without significant performance loss.
@inproceedings{schroedter2026bitwisequant, title = {Trainable Bitwise Soft Quantization for Input Feature Compression}, author = {Schrödter, Karsten and Stenkamp, Jan and Herrmann, Nina and Gieseke, Fabian}, booktitle = {Third Conference on Parsimony and Learning (CPAL)}, year = {2026}, tags = {ml,application,rs}, projects = {ai4forest} } -
 J. Stenkamp, M. Hunke, C. Karatas, S. Kirchhoff, C. Knaden, P. Naebers, L. Zhao, B. Karic, F. Gieseke, and N. HerrmannSENSYS26 ACM/IEEE International Conference on Embedded Artificial Intelligence and Sensing Systems (SenSys) 2026
As cities strive to reduce car dependency and promote sustainable transportation, encouraging bicycle usage becomes a vital part of the urban planning process. The existence of a sufficient number of bicycle storage facilities is a key building block, as it reduces the likelihood of bicycle theft and the necessity for bicycle repairs. By monitoring the utilization of bicycle parking lots, supply shortfalls can be detected, and users can be informed about the availability of slots. However, detection systems face multiple challenges. Equipping every parking slot with individual sensors is costly, and transmitting visual data can raise privacy concerns or even discourage users. To address this problem, embedded machine learning can be used to process visual data locally and transmit only the resulting count to a central server. This work sets out a real-world use case for microcontrollers that are equipped with a camera and an embedded machine learning model for the purpose of counting parked bicycles. A custom dataset was collected and labeled to train an object-detection model, which was subsequently compressed and deployed on an ESP32-S3 microcontroller that processes the image data locally and transmits only the bicycle count to a remote server via LoRaWAN. The model compression incurs only a marginal performance degradation, with the compressed model still achieving an AP@50 of 0.91. Hence, our approach demonstrates the practical realization of recent theoretical advances in tiny machine learning and provides a viable solution for monitoring bicycle parking facilities in real-world settings.
@inproceedings{Stenkampcountingparkedbicycles, title = {Counting Parked Bicycles on the Edge - A TinyML Smart City Application}, author = {Stenkamp, Jan and Hunke, Mathis and Karatas, Cem and Kirchhoff, Steffen and Knaden, Christoph and Naebers, Paul and Zhao, Lige and Karic, Benjamin and Gieseke, Fabian and Herrmann, Nina}, booktitle = {ACM/IEEE International Conference on Embedded Artificial Intelligence and Sensing Systems (SenSys)}, year = {2026}, tags = {ml,application,rs}, projects = {tinyaiot}, doi = {10.1145/3774906.3802788} } -
 N. Herrmann, J. Stenkamp, B. Karic, S. Oehmcke, and F. GiesekeICLR26 The Fourteenth International Conference on Learning Representations (ICLR) 2026
Deploying machine learning models on compute-constrained devices has become a key building block of modern IoT applications. In this work, we present a compression scheme for boosted decision trees, addressing the growing need for lightweight machine learning models. Specifically, we provide techniques for training compact boosted decision tree ensembles that exhibit a reduced memory footprint by rewarding, among other things, the reuse of features and thresholds during training. Our experimental evaluation shows that models achieved the same performance with a compression ratio of 4–16x compared to LightGBM models using an adapted training process and an alternative memory layout. Once deployed, the corresponding IoT devices can operate independently of constant communication or external energy supply, and, thus, autonomously, requiring only minimal computing power and energy. This capability opens the door to a wide range of IoT applications, including remote monitoring, edge analytics, and real-time decision making in isolated or power-limited environments.
@inproceedings{treesonadiet, title = {Boosted Trees on a Diet: Compact Models for Resource-Constrained Devices}, author = {Herrmann, Nina and Stenkamp, Jan and Karic, Benjamin and Oehmcke, Stefan and Gieseke, Fabian}, booktitle = {The Fourteenth International Conference on Learning Representations (ICLR)}, year = {2026}, tags = {ml,de,energy,rs}, projects = {tinyaiot}, url = {https://openreview.net/forum?id=batDcksZsh} } -
 K. Schrödter, J. Pauls, and F. GiesekeAISTATS26 Twenty-Ninth Annual Conference on Artificial Intelligence and Statistics (AISTATS) 2026
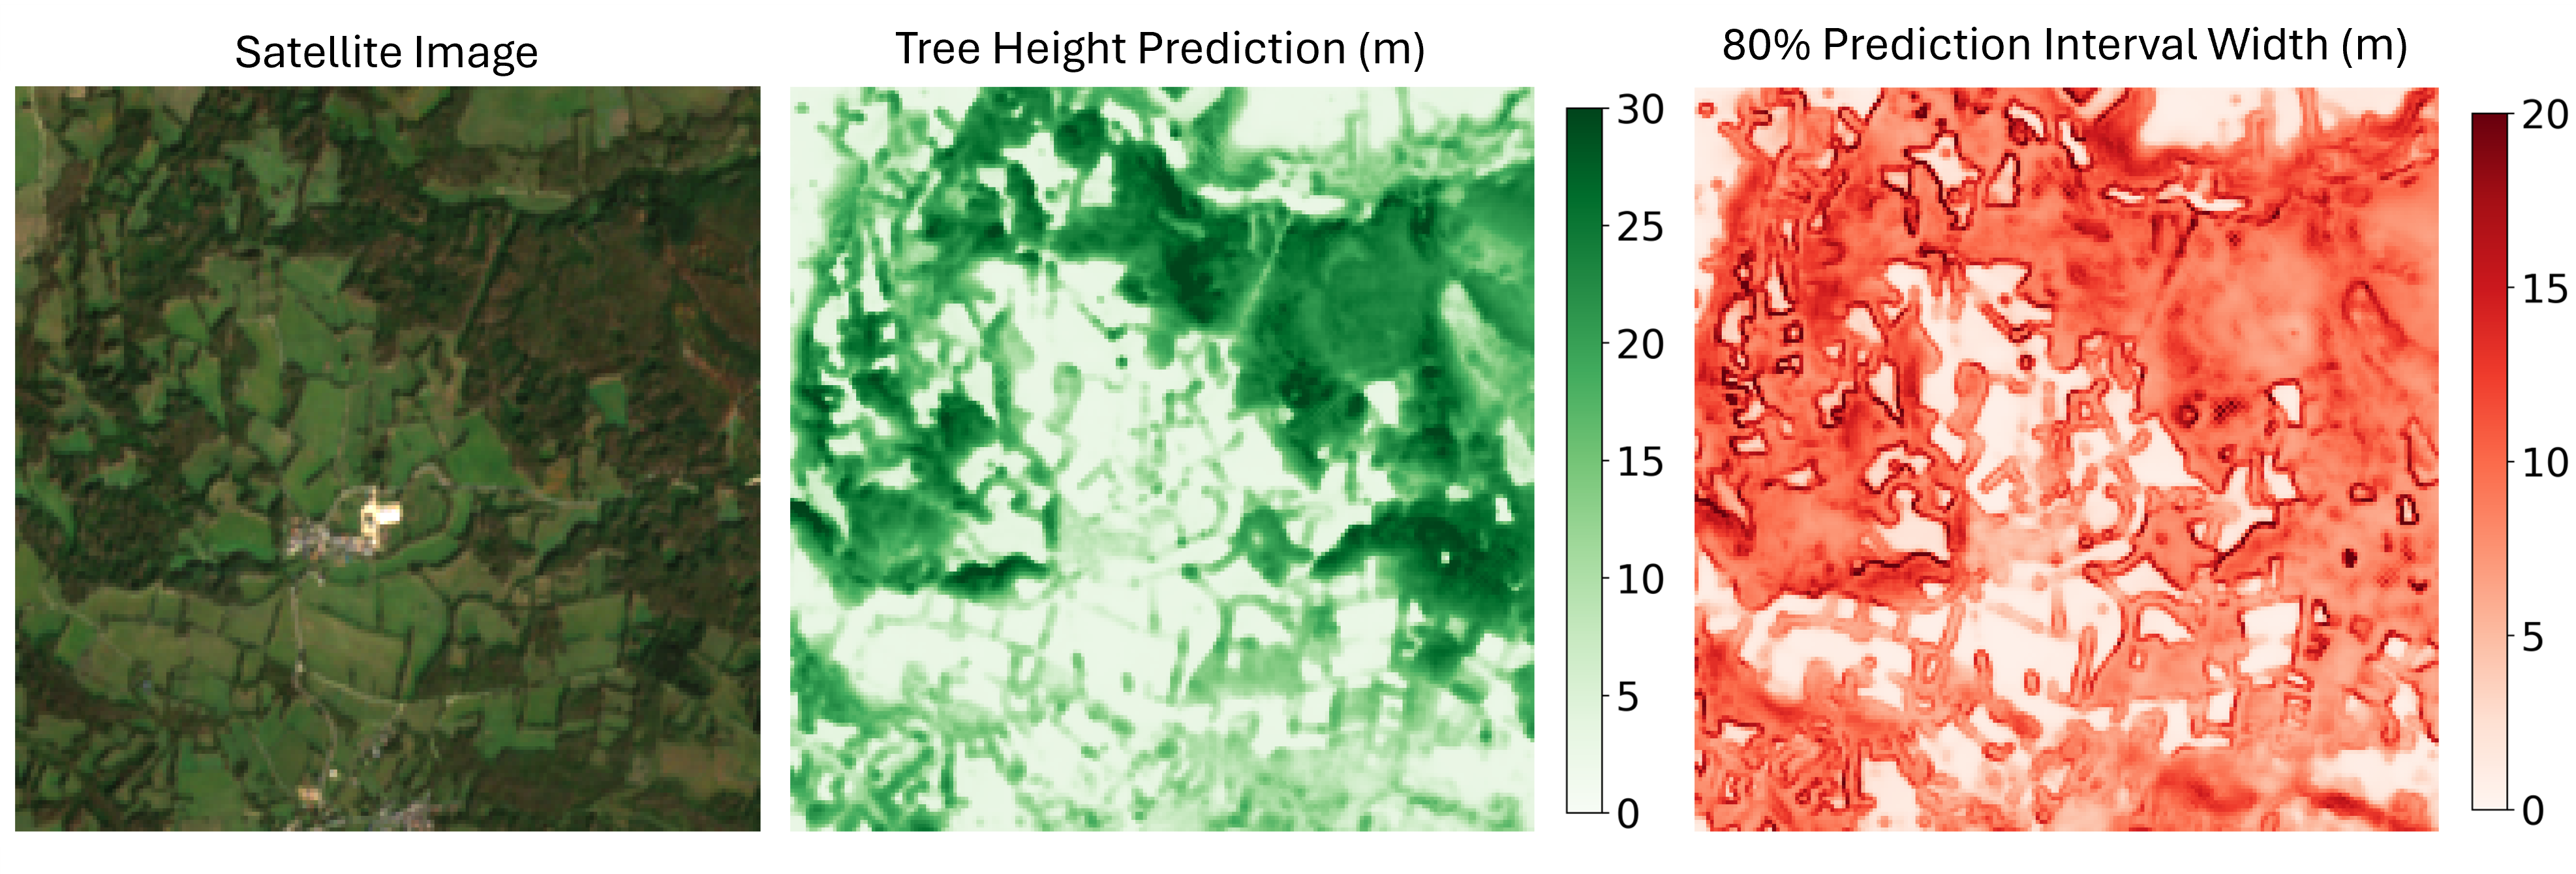
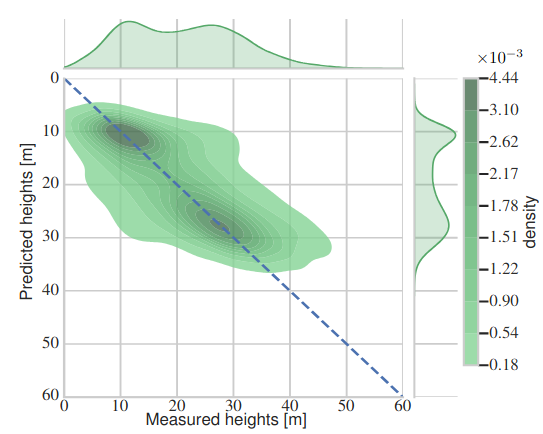
Accurate tree height estimation is vital for ecological monitoring and biomass assessment. We apply quantile regression to existing tree height estimation models based on satellite data to incorporate uncertainty quantification. Most current approaches on tree height estimation rely on point predictions, which limits their applicability in risk-sensitive scenarios. In this work, we show that with minor modifications to the prediction head, existing models can be adapted to provide statistically calibrated uncertainty estimates via quantile regression. Furthermore, we demonstrate how our results correlate with known challenges in remote sensing (e.g., terrain complexity, vegetation heterogeneity), indicating that the model is less confident in more challenging conditions.
@inproceedings{schroedter2026uncertaintytree, title = {Canopy Tree Height Estimation using Quantile Regression: Modeling and Evaluating Uncertainty in Remote Sensing}, author = {Schrödter, Karsten and Pauls, Jan and Gieseke, Fabian}, booktitle = {Twenty-Ninth Annual Conference on Artificial Intelligence and Statistics (AISTATS)}, year = {2026}, tags = {ml,application,rs}, projects = {ai4forest} } -
 P. N. Bernardino, W. D. Keersmaecker, S. Horion, R. V. D. Kerchove, S. Lhermitte, R. Fensholt, S. Oehmcke, F. Gieseke, K. V. Meerbeek, C. Abel, J. Verbesselt, and B. SomersJOURNALNature Climate Change 2025
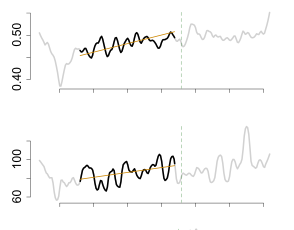
Climate change and human-induced land degradation threaten dryland ecosystems, vital to one-third of the global population and pivotal to inter-annual global carbon fluxes. Early warning systems are essential for guiding conservation, climate change mitigation and alleviating food insecurity in drylands. However, contemporary methods fail to provide large-scale early warnings effectively. Here we show that a machine learning-based approach can predict the probability of abrupt shifts in Sudano–Sahelian dryland vegetation functioning (75.1% accuracy; 76.6% precision) particularly where measures of resilience (temporal autocorrelation) are supplemented with proxies for vegetation and rainfall dynamics and other environmental factors. Regional-scale predictions for 2025 highlight a belt in the south of the study region with high probabilities of future shifts, largely linked to long-term rainfall trends. Our approach can provide valuable support for the conservation and sustainable use of dryland ecosystem services, particularly in the context of climate change projected drying trends.
@article{BernardinoKHKLFOGMAVS2025, author = {Bernardino, Paulo Negri and Keersmaecker, Wanda De and Horion, Stéphanie and Kerchove, Ruben Van De and Lhermitte, Stef and Fensholt, Rasmus and Oehmcke, Stefan and Gieseke, Fabian and Meerbeek, Koenraad Van and Abel, Christin and Verbesselt, Jan and Somers, Ben}, title = {Predictability of abrupt shifts in dryland ecosystem functioning}, journal = {Nature Climate Change}, year = {2025}, volume = {15}, pages = {86--91}, doi = {10.1038/s41558-024-02201-0}, tags = {application,rs}, } -
 M. Brandt, J. Chave, S. Li, R. Fensholt, P. Ciais, J. Wigneron, F. Gieseke, S. Saatchi, C. J. Tucker, and C. IgelJOURNALNature Reviews Electrical Engineering 2025
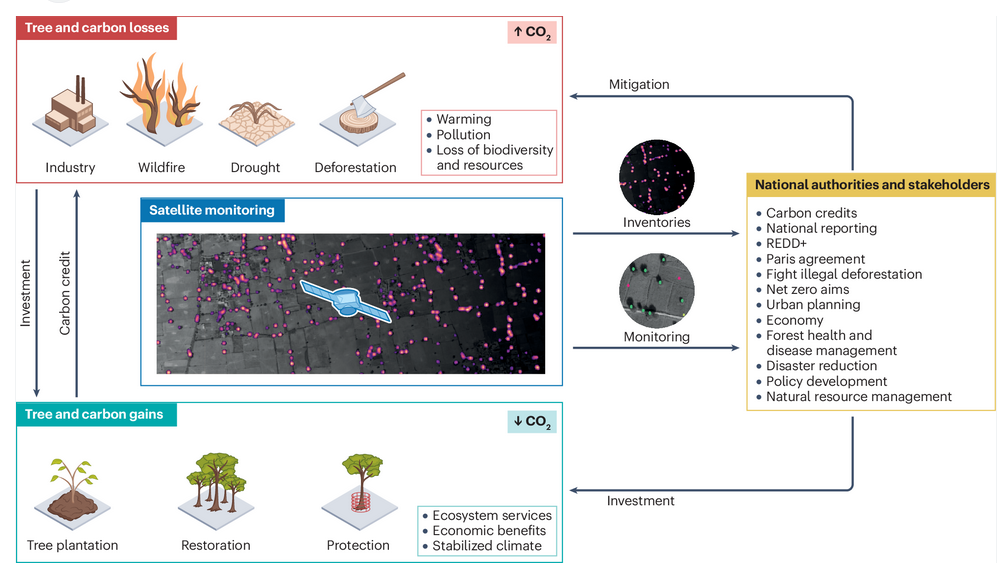
Trees contribute to carbon dioxide absorption through biomass, regulate the climate, support biodiversity, enhance soil, air and water quality, and offer economic and health benefits. Traditionally, tree monitoring on continental and global scales has focused on forest cover, whereas assessing biomass and species diversity, as well as trees outside closed-canopy forests, has been challenging. A new generation of commercial and public satellites and sensors provide high-resolution spatial and temporal optical data that can be used to identify trees as objects. Technologies from the field of artificial intelligence, such as convolutional neural networks and vision transformers, can go beyond detecting these objects as two-dimensional representations, and support characterization of the three-dimensional structure of objects, such as canopy height and wood volume, via contextual learning from two-dimensional images. These advancements enable reliable characterization of trees, their structure, biomass and diversity both inside and outside forests. Furthermore, self-supervision and foundation models facilitate large-scale applications without requiring extensive amounts of labels. Here, we summarize these advances, highlighting their application towards consistent tree monitoring systems that can assess carbon stocks, attribute losses and gains to underlying drivers and, ultimately, contribute to climate change mitigation.
@article{BrandtCLFCWGSTI2025HighResolution, author = {Brandt, Martin and Chave, Jerome and Li, Sizhuo and Fensholt, Rasmus and Ciais, Philippe and Wigneron, Jean-Pierre and Gieseke, Fabian and Saatchi, Sassan and Tucker, C. J. and Igel, Christian}, title = {High-resolution sensors and deep learning models for tree resource monitoring}, journal = {Nature Reviews Electrical Engineering}, year = {2025}, volume = {2}, pages = {13--26}, doi = {10.1038/s44287-024-00116-8}, tags = {application,rs}, } -
 S. Oehmcke, L. Li, K. Trepekli, J. C. Revenga, T. Nord-Larsen, F. Gieseke, and C. IgelJOURNALRemote Sensing of Environment 2024
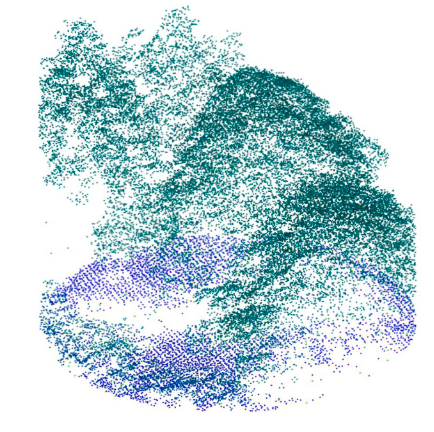
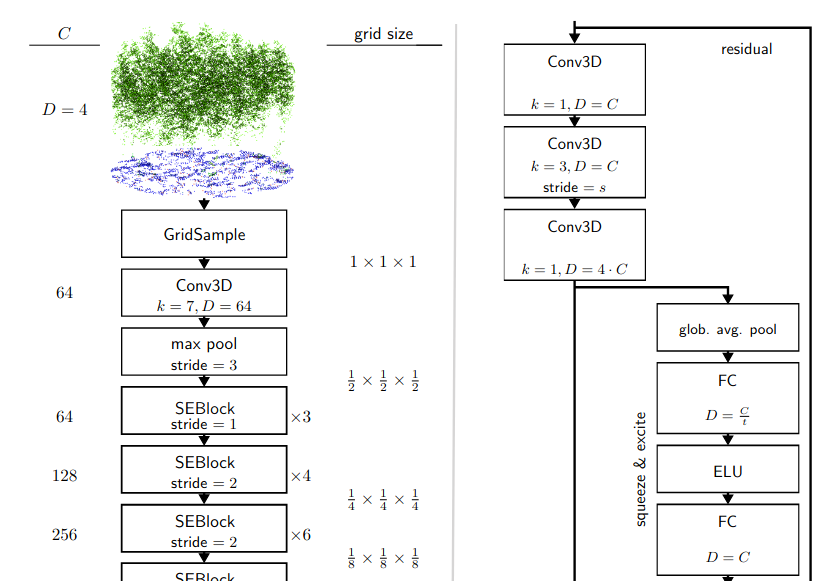
Quantifying forest biomass stocks and their dynamics is important for implementing effective climate change mitigation measures by aiding local forest management, studying processes driving af-, re-, and deforestation, and improving the accuracy of carbon accounting. Owing to the 3-dimensional nature of forest structure, remote sensing using airborne LiDAR can be used to perform these measurements of vegetation structure at large scale. Harnessing the full dimensionality of the data, we present deep learning systems predicting wood volume and above ground biomass (AGB) directly from the full LiDAR point cloud and compare results to state-of-the-art approaches operating on basic statistics of the point clouds. For this purpose, we devise different neural network architectures for point cloud regression and evaluate them on remote sensing data of areas for which AGB estimates have been obtained from field measurements in the Danish national forest inventory. Our adaptation of Minkowski convolutional neural networks for regression give the best results. The deep neural networks produce significantly more accurate wood volume, AGB, and carbon stock estimates compared to state-of-the-art approaches. In contrast to other methods, the proposed deep learning approach does not require a digital terrain model and is robust to artifacts along the boundaries of the evaluated areas, which we demonstrate for the case where trees protrude into the area from the outside. We expect this finding to have a strong impact on LiDAR-based analyses of biomass dynamics.
@article{OehmckeLTRNLGI2024DeepPointCloud, author = {Oehmcke, Stefan and Li, Lei and Trepekli, Katerina and Revenga, Jaime C. and Nord-Larsen, Thomas and Gieseke, Fabian and Igel, Christian}, title = {Deep point cloud regression for above-ground forest biomass estimation from airborne LiDAR}, journal = {Remote Sensing of Environment}, year = {2024}, volume = {302}, doi = {10.1016/j.rse.2023.113968}, tags = {rs,ml,application} } -
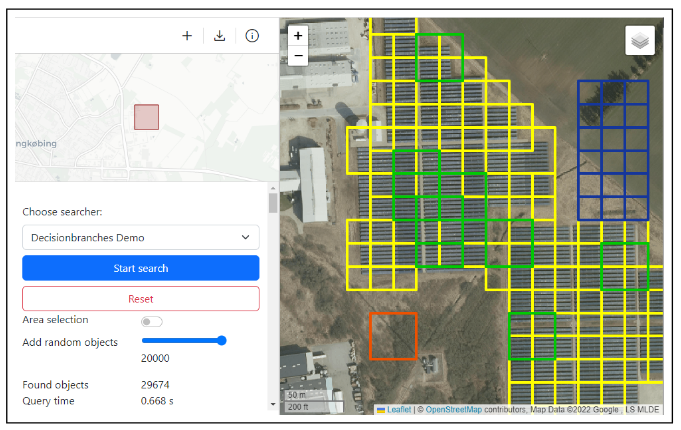 RapidEarth: A Search Engine for Large-Scale Geospatial Imagery Best Demo AwardC. Lülf, D. M. Lima Martins, S. M. A. Vaz, Y. Zhou, and F. GiesekeSIGSPATIAL23 Proceedings of the 31st International Conference on Advances in Geographic Information Systems, SIGSPATIAL, Demo Paper, 2023 (Best Demo Award) 2023
Data exploration and analysis in various domains often necessitate the search for specific objects in massive databases. A common search strategy, often known as search-by-classification, resorts to training machine learning models on small sets of positive and negative samples and to performing inference on the entire database to discover additional objects of interest. While such an approach often yields very good results in terms of classification performance, the entire database usually needs to be scanned, a process that can easily take several hours even for medium-sized data catalogs. In this work, we present RapidEarth, a geospatial search-by-classification engine that allows analysts to rapidly search for interesting objects in very large data collections of satellite imagery in a matter of seconds, without the need to scan the entire data catalog. RapidEarth embodies a co-design of multidimensional indexing structures and decision branches, a recently proposed variant of classical decision trees. These decision branches allow RapidEarth to transform the inference phase into a set of range queries, which can be efficiently processed by leveraging the aforementioned multidimensional indexing structures. The main contribution of this work is a geospatial search engine that implements these technical findings.
-
 S. Li, M. Brandt, R. Fensholt, A. Kariryaa, C. Igel, F. Gieseke, T. Nord-Larsen, S. Oehmcke, A. H. Carlsen, S. Junttila, X. Tong, A. d’Aspremont, and P. CiaisJOURNALPNAS Nexus 2023
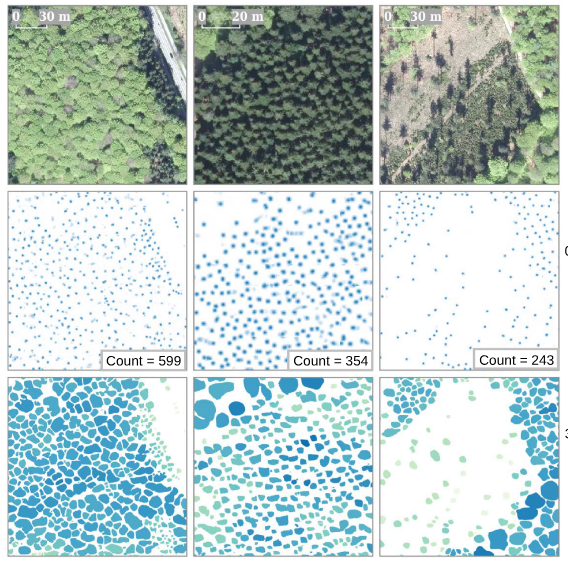
Sustainable tree resource management is the key to mitigating climate warming, fostering a green economy, and protecting valuable habitats. Detailed knowledge about tree resources is a prerequisite for such management but is conventionally based on plot-scale data, which often neglects trees outside forests. Here, we present a deep learning-based framework that provides location, crown area, and height for individual overstory trees from aerial images at country scale. We apply the framework on data covering Denmark and show that large trees (stem diameter >10 cm) can be identified with a low bias (12.5%) and that trees outside forests contribute to 30% of the total tree cover, which is typically unrecognized in national inventories. The bias is high (46.6%) when our results are evaluated against all trees taller than 1.3 m, which involve undetectable small or understory trees. Furthermore, we demonstrate that only marginal effort is needed to transfer our framework to data from Finland, despite markedly dissimilar data sources. Our work lays the foundation for digitalized national databases, where large trees are spatially traceable and manageable.
@article{LiSMRACFTSASXAP2023DeepLearning, author = {Li, Sizhuo and Brandt, Martin and Fensholt, Rasmus and Kariryaa, Ankit and Igel, Christian and Gieseke, Fabian and Nord-Larsen, Thomas and Oehmcke, Stefan and Carlsen, Ask Holm and Junttila, Samuli and Tong, Xiaoye and d’Aspremont, Alexandre and Ciais, Philippe}, title = {Deep learning enables image-based tree counting, crown segmentation, and height prediction at national scale}, journal = {PNAS Nexus}, year = {2023}, volume = {2}, number = {4}, doi = {10.1093/pnasnexus/pgad076}, tags = {rs,application,ml} } -
 F. Reiner, M. Brandt, X. Tong, D. Skole, A. Kariryaa, P. Ciais, A. Davies, P. Hiernaux, J. Chave, M. Mugabowindekwe, C. Igel, S. Oehmcke, F. Gieseke, S. Li, S. Liu, S. S. Saatchi, P. Boucher, J. Singh, S. Taugourdeau, M. Dendoncker, X. Song, O. Mertz, C. Tucker, and R. FensholtJOURNALNature Communications 2023
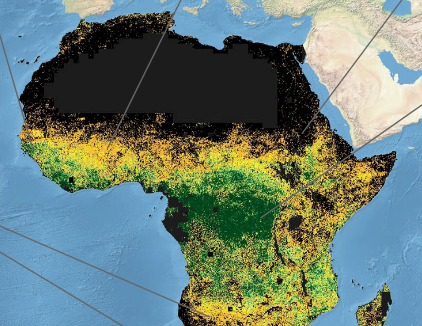
The consistent monitoring of trees both inside and outside of forests is key to sustainable land management. Current monitoring systems either ignore trees outside forests or are too expensive to be applied consistently across countries on a repeated basis. Here we use the PlanetScope nanosatellite constellation, which delivers global very high-resolution daily imagery, to map both forest and non-forest tree cover for continental Africa using images from a single year. Our prototype map of 2019 (RMSE = 9.57%, bias = −6.9%). demonstrates that a precise assessment of all tree-based ecosystems is possible at continental scale, and reveals that 29% of tree cover is found outside areas previously classified as tree cover in state-of-the-art maps, such as in croplands and grassland. Such accurate mapping of tree cover down to the level of individual trees and consistent among countries has the potential to redefine land use impacts in non-forest landscapes, move beyond the need for forest definitions, and build the basis for natural climate solutions and tree-related studies.
@article{ReinerBTSKCDHCMIOGLLSBSTDSMTF2023MoreThanOne, author = {Reiner, Florian and Brandt, Martin and Tong, Xiaoye and Skole, David and Kariryaa, Ankit and Ciais, Philippe and Davies, Andrew and Hiernaux, Pierre and Chave, Jerome and Mugabowindekwe, Maurice and Igel, Christian and Oehmcke, Stefan and Gieseke, Fabian and Li, Sizhuo and Liu, Siyu and Saatchi, Sassan S and Boucher, Peter and Singh, Jenia and Taugourdeau, Simon and Dendoncker, Morgane and Song, Xiao-Peng and Mertz, Ole and Tucker, Compton and Fensholt, Rasmus}, title = {More than one quarter of Africa's tree cover is found outside areas previously classified as forest}, journal = {Nature Communications}, year = {2023}, tags = {rs,application,ml} } -
 S. Oehmcke, L. Li, J. Revenga, T. Nord-Larsen, K. Trepekli, F. Gieseke, and C. IgelSIGSPATIAL22 30th ACM SIGSPATIAL International Conference on Advances in Geographic Information Systems (ACM SIGSPATIAL 2022) 2022
Quantification of forest biomass stocks and their dynamics is important for implementing effective climate change mitigation measures. The knowledge is needed, e.g., for local forest management, studying the processes driving af-, re-, and deforestation, and can improve the accuracy of carbon-accounting. Remote sensing using airborne LiDAR can be used to perform these measurements of vegetation structure at large scale. We present deep learning systems for predicting wood volume, above-ground biomass (AGB), and subsequently above-ground carbon stocks directly from airborne LiDAR point clouds. We devise different neural network architectures for point cloud regression and evaluate them on remote sensing data of areas for which AGB estimates have been obtained from field measurements in the Danish national forest inventory. Our adaptation of Minkowski convolutional neural networks for regression gave the best results. The deep neural networks produced significantly more accurate wood volume, AGB, and carbon stock estimates compared to state-of-the-art approaches operating on basic statistics of the point clouds. In contrast to other methods, the proposed deep learning approach does not require a digital terrain model. We expect this finding to have a strong impact on LiDAR-based analyses of biomass dynamics.
@inproceedings{OehmckeLRNLTGI2022DeepLearning, author = {Oehmcke, Stefan and Li, Lei and Revenga, Jaime and Nord-Larsen, Thomas and Trepekli, Katerina and Gieseke, Fabian and Igel, Christian}, title = {Deep Learning Based 3D Point Cloud Regression for Estimating Forest Biomass}, booktitle = {30th ACM SIGSPATIAL International Conference on Advances in Geographic Information Systems (ACM SIGSPATIAL 2022)}, pages = {1--4}, editor = {Renz, Matthias and Sarwat, Mohamed}, year = {2022}, publisher = {ACM Press}, address = {New York, NY, USA}, doi = {10.1145/3557915.3561471}, tags = {ml,application,rs} } -
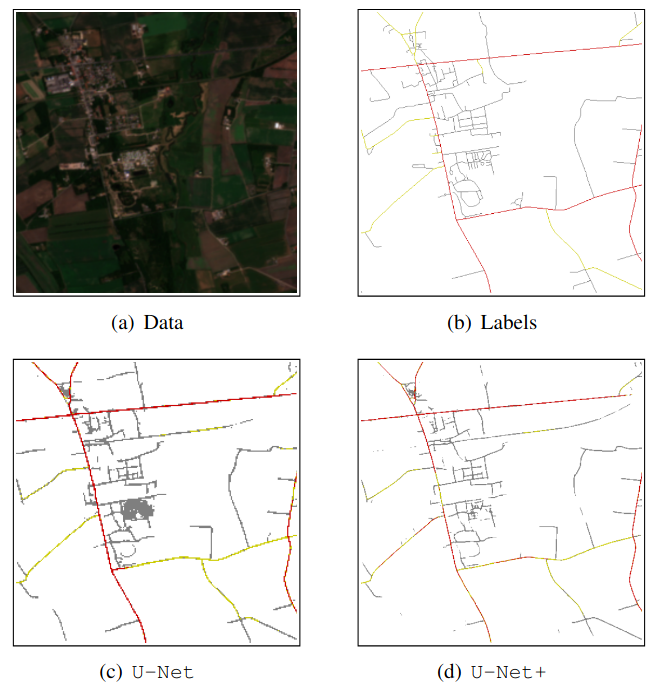
 R. N. Masolele, S. V. De, D. Marcos, J. Verbesselt, F. Gieseke, K. A. Mulatu, Y. Moges, H. Sebrala, C. Martius, and M. HeroldJOURNALGIScience and Remote Sensing 2022
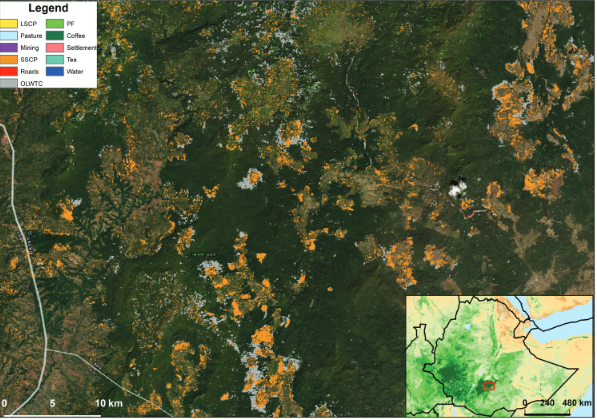
National-scale assessments of post-deforestation land-use are crucial for decreasing deforestation and forest degradation-related emissions. In this research, we assess the potential of different satellite data modalities (single-date, multi-date, multi-resolution, and an ensemble of multi-sensor images) for classifying land-use following deforestation in Ethiopia using the U-Net deep neural network architecture enhanced with attention. We performed the analysis on satellite image data retrieved across Ethiopia from freely available Landsat-8, Sentinel-2 and Planet-NICFI satellite data. The experiments aimed at an analysis of (a) single-date images from individual sensors to account for the differences in spatial resolution between image sensors in detecting land-uses, (b) ensembles of multiple images from different sensors (Planet-NICFI/Sentinel-2/Landsat-8) with different spatial resolutions, (c) the use of multi-date data to account for the contribution of temporal information in detecting land-uses, and, finally, (d) the identification of regional differences in terms of land-use following deforestation in Ethiopia. We hypothesize that choosing the right satellite imagery (sensor) type is crucial for the task. Based on a comprehensive visually interpreted reference dataset of 11 types of post-deforestation land-uses, we find that either detailed spatial patterns (single-date Planet-NICFI) or detailed temporal patterns (multi-date Sentinel-2, Landsat-8) are required for identifying land-use following deforestation, while medium-resolution single-date imagery is not sufficient to achieve high classification accuracy. We also find that adding soft-attention to the standard U-Net improved the classification accuracy, especially for small-scale land-uses. The models and products presented in this work can be used as a powerful data resource for governmental and forest monitoring agencies to design and monitor deforestation mitigation measures and data-driven land-use policy.
@article{MasoleleDMVGMMSMH2022UsingHighResolution, author = {Masolele, Robert N. and De, Sy Veronique and Marcos, Diego and Verbesselt, Jan and Gieseke, Fabian and Mulatu, Kalkidan Ayele and Moges, Yitebitu and Sebrala, Heiru and Martius, Christopher and Herold, Martin}, title = {Using high-resolution imagery and deep learning to classify land-use following deforestation: a case study in Ethiopia}, journal = {GIScience and Remote Sensing}, year = {2022}, volume = {59}, number = {1}, pages = {1446--1472}, doi = {10.1080/15481603.2022.2115619}, tags = {application,rs}, } -
 M. Mugabowindekwe, M. Brandt, J. Chave, F. Reiner, D. Skole, A. Kariryaa, C. Igel, P. Hiernaux, P. Ciais, O. Mertz, X. Tong, S. Li, G. Rwanyiziri, T. Dushimiyimana, A. Ndoli, U. Valens, J. Lillesø, F. Gieseke, C. Tucker, S. S. Saatchi, and R. FensholtJOURNALNature Climate Change 2022
Trees sustain livelihoods and mitigate climate change but a predominance of trees outside forests and limited resources make it difficult for many tropical countries to conduct automated nation-wide inventories. Here, we propose an approach to map the carbon stock of each individual overstory tree at the national scale of Rwanda using aerial imagery from 2008 and deep learning. We show that 72% of the mapped trees are located in farmlands and savannas and 17% in plantations, accounting for 48.6% of the national aboveground carbon stocks. Natural forests cover 11% of the total tree count and 51.4% of the national carbon stocks, with an overall carbon stock uncertainty of 16.9%. The mapping of all trees allows partitioning to any landscapes classification and is urgently needed for effective planning and monitoring of restoration activities as well as for optimization of carbon sequestration, biodiversity and economic benefits of trees.
@article{MugabowindekweBCRSKIHCMTLRDNVLGTSF2022NationWide, author = {Mugabowindekwe, Maurice and Brandt, Martin and Chave, Jerome and Reiner, Florian and Skole, David and Kariryaa, Ankit and Igel, Christian and Hiernaux, Pierre and Ciais, Philippe and Mertz, Ole and Tong, Xiaoye and Li, Sizhuo and Rwanyiziri, Gaspard and Dushimiyimana, Thaulin and Ndoli, Alain and Valens, Uwizeyimana and Lillesø, Jens-Peter and Gieseke, Fabian and Tucker, Compton and Saatchi, Sassan S and Fensholt, Rasmus}, title = {Nation-wide mapping of tree-level aboveground carbon stocks in Rwanda}, journal = {Nature Climate Change}, year = {2022}, volume = {13}, doi = {10.1038/s41558-022-01544-w}, tags = {application,rs}, } -
 J. C. Revenga, K. Trepekli, S. Oehmcke, R. Jensen, L. Li, C. Igel, F. Gieseke, and T. FriborgJOURNALRemote Sensing (Remote Sens.) 2022
Current endeavors to enhance the accuracy of in situ above-ground biomass (AGB) prediction for croplands rely on close-range monitoring surveys that use unstaffed aerial vehicles (UAVs) and mounted sensors. In precision agriculture, light detection and ranging (LiDAR) technologies are currently used to monitor crop growth, plant phenotyping, and biomass dynamics at the ecosystem scale. In this study, we utilized a UAV–LiDAR sensor to monitor two crop fields and a set of machine learning (ML) methods to predict real-time AGB over two consecutive years in the region of Mid-Jutland, Denmark. During each crop growing period, UAV surveys were conducted in parallel with AGB destructive sampling every 7–15 days, the AGB samples from which were used as the ground truth data. We evaluated the ability of the ML models to estimate the real-time values of AGB at a sub-meter resolution (0.17–0.52 m2). An extremely randomized trees (ERT) regressor was selected for the regression analysis, based on its predictive performance for the first year’s growing season. The model was retrained using previously identified hyperparameters to predict the AGB of the crops in the second year. The ERT performed AGB estimation using height and reflectance metrics from LiDAR-derived point cloud data and achieved a prediction performance of 𝑅2 = 0.48 at a spatial resolution of 0.35 m2. The prediction performance could be improved significantly by aggregating adjacent predictions (𝑅2 = 0.71 and 𝑅2 = 0.93 at spatial resolutions of 1 m2 and 2 m2, respectively) as they ultimately converged to the reference biomass values because any individual errors averaged out. The AGB prediction results were examined as function of predictor type, training set size, sampling resolution, phenology, and canopy density. The results demonstrated that when combined with ML regression methods, the UAV–LiDAR method could be used to provide accurate real-time AGB prediction for crop fields at a high resolution, thereby providing a way to map their biochemical constituents.
@article{RevengaTOJLIGF2022AboveGround, author = {Revenga, Jaime C. and Trepekli, Katerina and Oehmcke, Stefan and Jensen, Rasmus and Li, Lei and Igel, Christian and Gieseke, Fabian and Friborg, Thomas}, title = {Above-Ground Biomass Prediction for Croplands at a Sub-Meter Resolution Using UAV–LiDAR and Machine Learning Methods}, journal = {Remote Sensing (Remote Sens.)}, year = {2022}, volume = {14}, number = {16}, pages = {3912}, doi = {10.3390/rs14163912}, tags = {application,rs} } -
 S. Oehmcke, T. Nyegaard-Signori, K. Grogan, and F. GiesekeIEEE BIGDATA 2021 2021 IEEE International Conference on Big Data (Big Data) 2021
Canopy height is a vital indicator to asses carbon uptake and productivity of forests. However, precise measurements, such as from airborne or spaceborne 3D laser scanning (LiDAR), are expensive and usually cover only small areas. In this work, we propose a novel deep learning model that can generate detailed maps of tree canopy heights. In contrast to previous approaches that use a single image as input, we process multi-temporal data via a an adaptation of the popular U-Net architecture that is based on the EfficientNet and 3D convolution operators. To that end, our model receives multi-spectral Landsat satellite imagery as input and can predict continuous height maps. As labeled data, we resort to spatially sparse LiDAR data from ICESat-2. Thus, with such a model, one can produce dense canopy height maps given only multi-spectral Landsat data. Our experimental evaluation shows that our our model outperforms existing and improved single-temporal models. To test generalizability, we created a non-overlapping dataset to evaluate our approach and further tested the model performance on out-of-distribution data. The results show that our model can successfully learn drastic changes in distribution.
@inproceedings{OehmckeNSGG2021Estimating, author = {Oehmcke, Stefan and Nyegaard-Signori, Thomas and Grogan, Kenneth and Gieseke, Fabian}, title = {Estimating Forest Canopy Height With Multi-Spectral and Multi-Temporal Imagery Using Deep Learning}, booktitle = {2021 {IEEE} International Conference on Big Data (Big Data)}, pages = {4915--4924}, editor = {Chen, Yixin and Ludwig, Heiko and Tu, Yicheng and Fayyad, Usama M. and Zhu, Xingquan and Hu, Xiaohua and Byna, Suren and Liu, Xiong and Zhang, Jianping and Pan, Shirui and Papalexakis, Vagelis and Wang, Jianwu and Cuzzocrea, Alfredo and Ordonez, Carlos}, year = {2021}, publisher = {Wiley-IEEE Press}, address = {Orlando, US}, doi = {10.1109/BigData52589.2021.9672018}, tags = {application,rs}, } -
 R. N. Masolele, V. De Sy, M. Herold, D. Marcos, J. Verbesselt, F. Gieseke, A. G. Mullissa, and C. MartiusJOURNALRemote Sensing of Environment 2021
Assessing land-use following deforestation is vital for reducing emissions from deforestation and forest degradation. In this paper, for the first time, we assess the potential of spatial, temporal and spatio-temporal deep learning methods for large-scale classification of land-use following tropical deforestation using dense satellite time series over six years on the pan-tropical scale (incl. Latin America, Africa, and Asia). Based on an extensive reference database of six forest to land-use conversion types, we find that the spatio-temporal models achieved a substantially higher F1-score accuracies than models that account only for spatial or temporal patterns. Although all models performed better when the scope of the problem was limited to a single continent, the spatial models were more competitive than the temporal ones in this setting. These results suggest that the spatial patterns of land-use within a continent share more commonalities than the temporal patterns and the spatial patterns across continents. This work explores the feasibility of extending and complementing previous efforts for characterizing follow-up land-use after deforestation at a small-scale via human visual interpretation of high resolution RGB imagery. It supports the usage of fast and automated large-scale land-use classification and showcases the value of deep learning methods combined with spatio-temporal satellite data to effectively address the complex tasks of identifying land-use following deforestation in a scalable and cost effective manner.
@article{MasoleleDHMVGMM2021SpatialAnd, author = {Masolele, Robert N. and {De Sy}, Veronique and Herold, Martin and Marcos, Diego and Verbesselt, Jan and Gieseke, Fabian and Mullissa, Adugna G. and Martius, Christopher}, title = {Spatial and temporal deep learning methods for deriving land-use following deforestation: A pan-tropical case study using Landsat time series}, journal = {Remote Sensing of Environment}, year = {2021}, volume = {264}, pages = {112600}, doi = {10.1016/j.rse.2021.112600}, tags = {application,rs}, } -
 F. Gieseke, S. Rosca, T. Henriksen, J. Verbesselt, and C. E. OanceaICDE20 Proceedings of the 36th IEEE International Conference on Data Engineering (ICDE) 2020
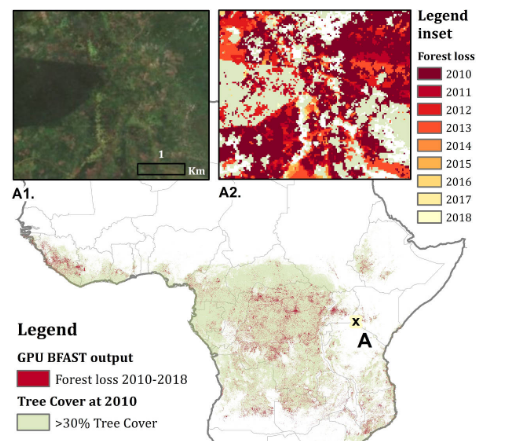
Large amounts of satellite data are now becoming available, which, in combination with appropriate change detection methods, offer the opportunity to derive accurate information on timing and location of disturbances such as deforestation events across the earth surface. Typical scenarios require the analysis of billions of image patches/pixels. While various change detection techniques have been proposed in the literature, the associated implementations usually do not scale well, which renders the corresponding analyses computationally very expensive or even impossible. In this work, we propose a novel massively-parallel implementation for a state-of-the-art change detection method and demonstrate its potential in the context of monitoring deforestation. The novel implementation can handle large scenarios in a few hours or days using cheap commodity hardware, compared to weeks or even years using the existing publicly available code, and enables researchers, for the first time, to conduct global-scale analyses covering large parts of our Earth using little computational resources. From a technical perspective, we provide a high-level parallel algorithm specification along with several performance-critical optimizations dedicated to efficiently map the specified parallelism to modern parallel devices. While a particular change detection method is addressed in this work, the algorithmic building blocks provided are also of immediate relevance to a wide variety of related approaches in remote sensing and other fields.
@inproceedings{GiesekeRHVO2020MassivelyParallel, author = {Gieseke, Fabian and Rosca, Sabina and Henriksen, Troels and Verbesselt, Jan and Oancea, Cosmin Eugen}, title = {Massively-Parallel Change Detection for Satellite Time Series Data with Missing Values}, booktitle = {Proceedings of the 36th {IEEE} International Conference on Data Engineering (ICDE)}, pages = {385--396}, year = {2020}, address = {Dallas, USA}, doi = {10.1109/ICDE48307.2020.00040}, tags = {de,rs}, } -
 S. Oehmcke, T. K. Chen, A. V. Prishchepov, and F. GiesekeBIGSPATIAL20 Proceedings of the 9th ACM SIGSPATIAL International Workshop on Analytics for Big Geospatial Data 2020
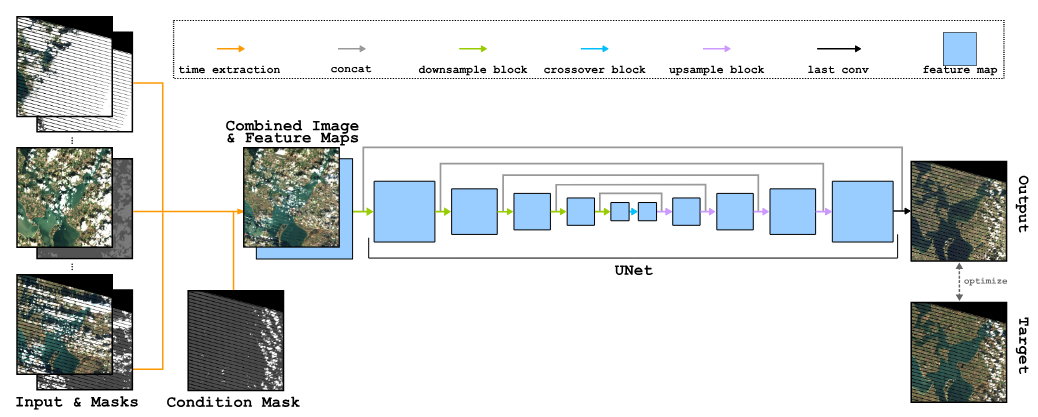
Optical satellite images are important for environmental monitoring. Unfortunately, such images are often affected by distortions, such as clouds, shadows, or missing data. This work proposes a deep learning approach for cleaning and imputing satellite images, which could serve as a reliable preprocessing step for spatial and spatio-temporal analyzes. More specifically, a coherent and cloud-free image for a specific target date and region is created based on a sequence of images of that region obtained at previous dates. Our model first extracts information from the previous time steps via a special gating function and then resorts to a modified version of the well-known U-Net architecture to obtain the desired output image. The model uses supplementary data, namely the approximate cloud coverage of input images, the temporal distance to the target time, and a missing data mask for each input time step. During the training phase we condition our model with the targets cloud coverage and missing values (disabled in production), which allows us to use data afflicted by distortion during training and thus does not require pre-selection of distortion-free data. Our experimental evaluation, conducted on data of the Landsat missions, shows that our approach outperforms the commonly utilized approach that resorts to taking the median of cloud-free pixels for a given position. This is especially the case when the quality of the data for the considered period is poor (e.g., lack of cloud free-images during the winter/fall periods). Our deep learning approach allows to improve the utility of the entire Landsat archive, the only existing global medium-resolution free-access satellite archive dating back to the 1970s. It therefore holds scientific and societal potential for future analyses conducted on data from this and other satellite imagery repositories.
@inproceedings{OehmckeTHPG2020CreatingCloudFree, author = {Oehmcke, Stefan and Chen, Tzu-Hsin Karen and Prishchepov, Alexander V. and Gieseke, Fabian}, title = {Creating Cloud-Free Satellite Imagery from Image Time Series with Deep Learning}, booktitle = {Proceedings of the 9th ACM SIGSPATIAL International Workshop on Analytics for Big Geospatial Data}, pages = {3:1-3:10}, year = {2020}, publisher = {ACM}, address = {Seattle, USA}, doi = {10.1145/3423336.3429345}, tags = {ml,de,rs,application}, } -
 M. Brandt, C. Tucker, A. Kariryaa, K. Rasmussen, C. Abel, J. Small, J. Chave, L. Rasmussen, P. Hiernaux, A. Diouf, L. Kergoat, O. Mertz, C. Igel, F. Gieseke, J. Schöning, S. Li, K. Melocik, J. Meyer, SinnoS, E. Romero, E. Glennie, A. Montagu, M. Dendoncker, and R. FensholtJOURNALNature 2020
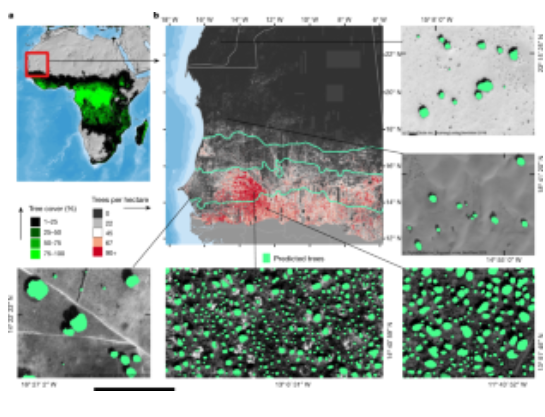
A large proportion of dryland trees and shrubs (hereafter referred to collectively as trees) grow in isolation, without canopy closure. These non-forest trees have a crucial role in biodiversity, and provide ecosystem services such as carbon storage, food resources and shelter for humans and animals. However, most public interest relating to trees is devoted to forests, and trees outside of forests are not well-documented. Here we map the crown size of each tree more than 3 m2 in size over a land area that spans 1.3 million km2 in the West African Sahara, Sahel and sub-humid zone, using submetre-resolution satellite imagery and deep learning. We detected over 1.8 billion individual trees (13.4 trees per hectare), with a median crown size of 12 m2, along a rainfall gradient from 0 to 1,000 mm per year. The canopy cover increases from 0.1% (0.7 trees per hectare) in hyper-arid areas, through 1.6% (9.9 trees per hectare) in arid and 5.6% (30.1 trees per hectare) in semi-arid zones, to 13.3% (47 trees per hectare) in sub-humid areas. Although the overall canopy cover is low, the relatively high density of isolated trees challenges prevailing narratives about dryland desertification, and even the desert shows a surprisingly high tree density. Our assessment suggests a way to monitor trees outside of forests globally, and to explore their role in mitigating degradation, climate change and poverty.
@article{BrandtTKRASCRHDKMIGSLMMSRGMDF2020AnUnexpectedly, author = {Brandt, M and Tucker, C and Kariryaa, A and Rasmussen, K and Abel, C and Small, J and Chave, J and Rasmussen, L and Hiernaux, P and Diouf, A and Kergoat, L and Mertz, O and Igel, C and Gieseke, F and Schöning, J and Li, S and Melocik, K and Meyer, J and SinnoS and Romero, E and Glennie, E and Montagu, A and Dendoncker, M and Fensholt, R}, title = {An unexpectedly large count of trees in the West African Sahara and Sahel}, journal = {Nature}, year = {2020}, volume = {2020}, doi = {10.1038/s41586-020-2824-5}, tags = {application,rs,ml} } -
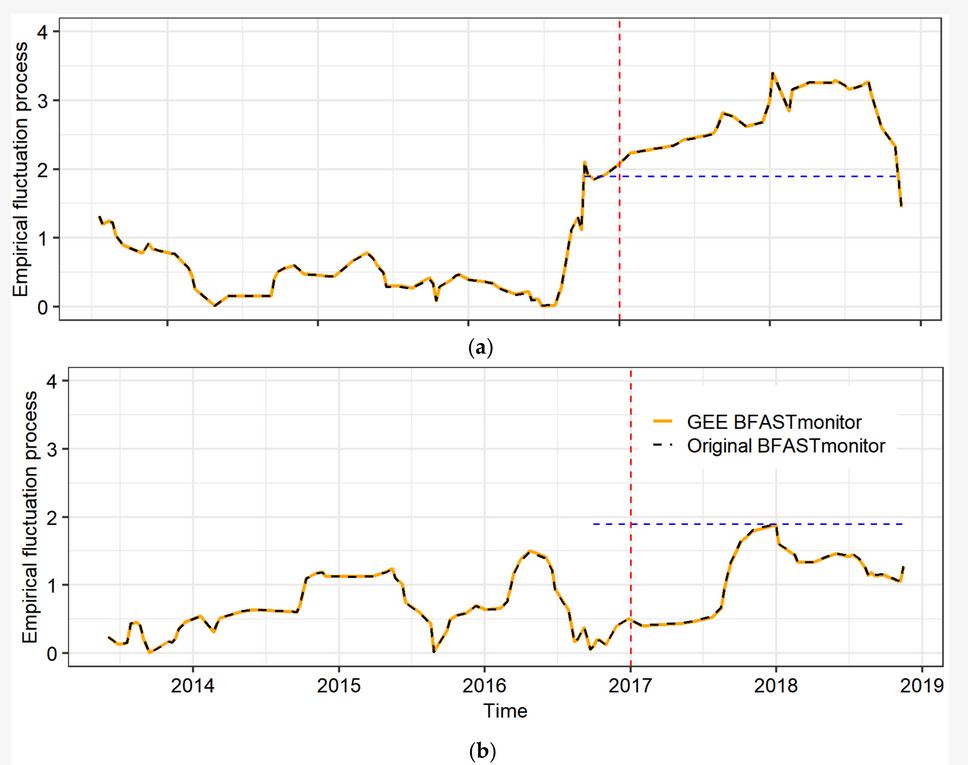 E. Hamunyela, S. Rosca, A. Mirt, E. Engle, M. Herold, F. Gieseke, and J. Verbesselt.JOURNALRemote Sensing 2020
Monitoring of abnormal changes on the earth’s surface (e.g., forest disturbance) has improved greatly in recent years because of satellite remote sensing. However, high computational costs inherently associated with processing and analysis of satellite data often inhibit large-area and sub-annual monitoring. Normal seasonal variations also complicate the detection of abnormal changes at sub-annual scale in the time series of satellite data. Recently, however, computationally powerful platforms, such as the Google Earth Engine (GEE), have been launched to support large-area analysis of satellite data. Change detection methods with the capability to detect abnormal changes in time series data while accounting for normal seasonal variations have also been developed but are computationally intensive. Here, we report an implementation of BFASTmonitor (Breaks For Additive Season and Trend monitor) on GEE to support large-area and sub-annual change monitoring using satellite data available in GEE. BFASTmonitor is a data-driven unsupervised change monitoring approach that detects abnormal changes in time series data, with near real-time monitoring capabilities. Although BFASTmonitor has been widely used in forest cover loss monitoring, it is a generic change monitoring approach that can be used to monitor changes in a various time series data. Using Landsat time series for normalised difference moisture index (NDMI), we evaluated the performance of our GEE BFASTmonitor implementation (GEE BFASTmonitor) by detecting forest disturbance at three forest areas (humid tropical forest, dry tropical forest, and miombo woodland) while comparing it to the original R-based BFASTmonitor implementation (original BFASTmonitor). A map-to-map comparison showed that the spatial and temporal agreements on forest disturbance between the original and our GEE BFASTmonitor implementations were high. At each site, the spatial agreement was more than 97%, whereas the temporal agreement was over 94%. The high spatial and temporal agreement show that we have properly translated and implemented the BFASTmonitor algorithm on GEE. Naturally, due to different numerical solvers being used for regression model fitting in R and GEE, small differences could be observed in the outputs. These differences were most noticeable at the dry tropical forest and miombo woodland sites, where the forest exhibits strong seasonality. To make GEE BFASTmonitor accessible to non-technical users, we developed a web application with simplified user interface. We also created a JavaScript-based GEE BFASTmonitor package that can be imported as a module. Overall, our GEE BFASTmonitor implementation fills an important gap in large-area environmental change monitoring using earth observation data.
@article{HamunyelaRMEHGV2020Implementation, author = {Hamunyela, Eliakim and Rosca, Sabina and Mirt, Andrei and Engle, Eric and Herold, Martin and Gieseke, Fabian and Verbesselt., Jan}, title = {Implementation of BFASTmonitor Algorithm on Google Earth Engine to Support Large-Area and Sub-Annual Change Monitoring Using Earth Observation Data}, journal = {Remote Sensing}, year = {2020}, volume = {12}, number = {18}, doi = {10.3390/rs12182953}, tags = {application,rs} } -
 S. Oehmcke, C. Thrysøe, A. Borgstad, M. V. Salles, M. Brandt, and F. GiesekeIEEE BIGDATA 2019 2019 IEEE International Conference on Big Data (IEEE BigData) 2019
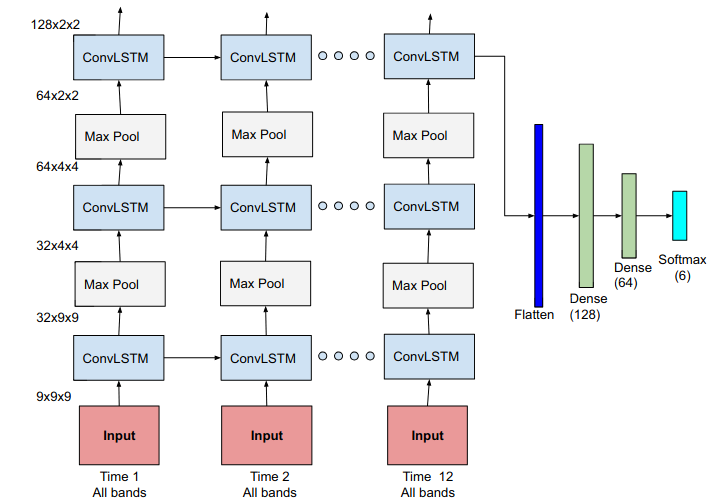
Massive amounts of satellite data have been gathered over time, holding the potential to unveil a spatiotemporal chronicle of the surface of Earth. These data allow scientists to investigate various important issues, such as land use changes, on a global scale. However, not all land-use phenomena are equally visible on satellite imagery. In particular, the creation of an inventory of the planet’s road infrastructure remains a challenge, despite being crucial to analyze urbanization patterns and their impact. Towards this end, this work advances data-driven approaches for the automatic identification of roads based on open satellite data. Given the typical resolutions of these historical satellite data, we observe that there is inherent variation in the visibility of different road types. Based on this observation, we propose two deep learning frameworks that extend state-of-the-art deep learning methods by formalizing road detection as an ordinal classification task. In contrast to related schemes, one of the two models also resorts to satellite time series data that are potentially affected by missing data and cloud occlusion. Taking these time series data into account eliminates the need to manually curate datasets of high-quality image tiles, substantially simplifying the application of such models on a global scale. We evaluate our approaches on a dataset that is based on Sentinel 2 satellite imagery and OpenStreetMap vector data. Our results indicate that the proposed models can successfully identify large and medium-sized roads. We also discuss opportunities and challenges related to the detection of roads and other infrastructure on a global scale.
@inproceedings{OehmckeTBMBG2019DetectingHardly,
  author = {Oehmcke, Stefan and Thrysøe, Christoph and Borgstad, Andreas and Salles, Marcos Vaz and Brandt, Martin and Gieseke, Fabian},
  title = {Detecting Hardly Visible Roads in Low-Resolution Satellite Time Series Data},
  booktitle = {2019 {IEEE} International Conference on Big Data {(IEEE} BigData)},
  pages = {2403--2412},
  year = {2019},
  publisher = {IEEE},
  doi = {10.1109/BigData47090.2019.9006251},
  tags = {ml,application,rs},
}


