Publications tagged "application"
-
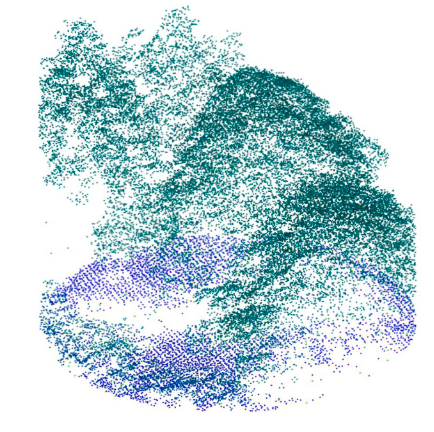
 J. C. Revenga, S. Oehmcke, M. Gharun, F. Sutter, F. Gieseke, K. Trepekli, N. Buchmann, and A. DammEcological Solutions and Evidence 2026
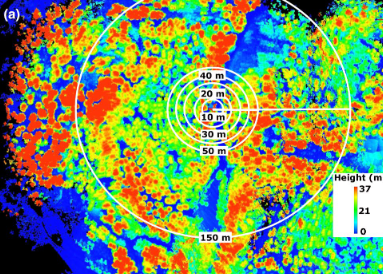
Abstract Forest structure, tree diameter, and above-ground biomass (AGB) are central variables in trait-based ecology and forest management, and recent advances in Unmanned Aerial Vehicle (UAV) and LiDAR surveys have substantially improved tree-level phenotyping of these attributes. Building on these developments, machine learning (ML) applications are increasingly used to refine tree diameter estimates and, by extension, improve AGB predictions derived from allometric relationships. Here, we evaluated the capacity of shallow learning methods to leverage local contextual information surrounding a tree of interest to improve predictions of stem diameter and tree-level AGB over 33 ha of a Norway spruce forest (Davos, CH). Our objectives were to (i) characterize gradients of tree height, (ii) examine group-level morphology of tree assemblages as an indicator of forest structural organization and (iii) assess whether these patterns can be leveraged to improve tree diameter and AGB predictions. We segmented the LiDAR point cloud scene into individual canopies and focused on LiDAR-derived tree canopy features. We then used local indicators of spatial association of tree heights to characterize local context and identify tree assemblages within the forest. Assemblage-level metrics were first analysed to characterize forest spatial structure and ecological similarity, and subsequently evaluated as additional predictors in ML regression experiments for tree diameter. Performance was compared between twin regression methods that either incorporated assemblage metrics (i.e. context-aware) or did not. Improvements provided by context awareness were assessed in terms of accuracy gained in estimating tree diameter and AGB. We evaluated three shallow learning methods using nested cross-validation and considered two datasets from the same site: one spatially sparse, based on scattered sampling plots, and one spatially continuous. In both sparse and continuous datasets, we found enhanced prediction performance in context-aware regressions, with RMSE for tree diameter estimation reduced by 4.1% and 0.8%, respectively, suggesting that heterogeneous local context supports improved estimates. Practical implication: Gradients of tree height can reflect underlying ecological drivers of forest structure, and this structural information may be leveraged to enhance predictions of tree diameter and AGB. The proposed method is fully native to UAV LiDAR data.
-
 K. Schrödter, J. Stenkamp, N. Herrmann, and F. GiesekeCPAL26 Third Conference on Parsimony and Learning (CPAL) 2026
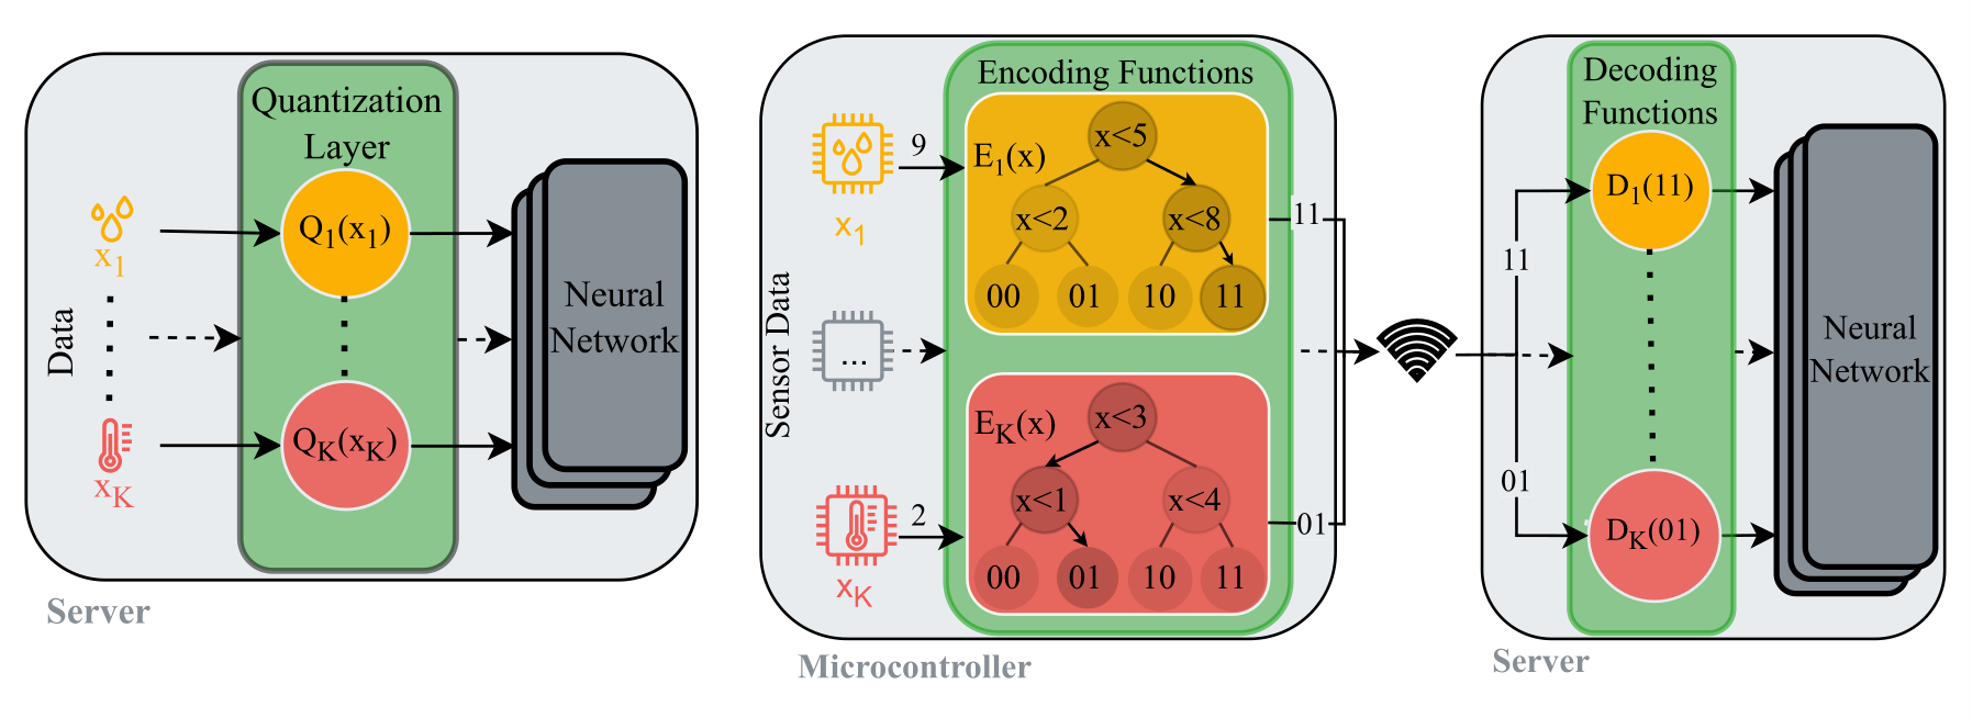
The growing demand for machine learning applications in the context of the Internet of Things calls for new approaches to optimize the use of limited compute and memory resources. Despite significant progress that has been made w.r.t. reducing model sizes and improving efficiency, many applications still require remote servers to provide the required resources. However, such approaches rely on transmitting data from edge devices to remote servers, which may not always be feasible due to bandwidth, latency, or energy constraints. We propose a task-specific, trainable feature quantization layer that compresses the input features of a neural network. This can significantly reduce the amount of data that needs to be transferred from the device to a remote server. In particular, the layer allows each input feature to be quantized to a user-defined number of bits, enabling a simple on-device compression at the time of data collection. The layer is designed to approximate step functions with sigmoids, enabling trainable quantization thresholds. By concatenating outputs from multiple sigmoids, introduced as bitwise soft quantization, it achieves trainable quantized values when integrated with a neural network. We compare our method to full-precision inference as well as to several quantization baselines. Experiments show that our approach outperforms standard quantization methods, while maintaining accuracy levels close to those of full-precision models. In particular, depending on the dataset at hand, compression factors of to can be achieved without significant performance loss.
@inproceedings{schroedter2026bitwisequant, title = {Trainable Bitwise Soft Quantization for Input Feature Compression}, author = {Schrödter, Karsten and Stenkamp, Jan and Herrmann, Nina and Gieseke, Fabian}, booktitle = {Third Conference on Parsimony and Learning (CPAL)}, year = {2026}, tags = {ml,application,rs}, projects = {ai4forest} } -
 J. Stenkamp, M. Hunke, C. Karatas, S. Kirchhoff, C. Knaden, P. Naebers, L. Zhao, B. Karic, F. Gieseke, and N. HerrmannSENSYS26 ACM/IEEE International Conference on Embedded Artificial Intelligence and Sensing Systems (SenSys) 2026
As cities strive to reduce car dependency and promote sustainable transportation, encouraging bicycle usage becomes a vital part of the urban planning process. The existence of a sufficient number of bicycle storage facilities is a key building block, as it reduces the likelihood of bicycle theft and the necessity for bicycle repairs. By monitoring the utilization of bicycle parking lots, supply shortfalls can be detected, and users can be informed about the availability of slots. However, detection systems face multiple challenges. Equipping every parking slot with individual sensors is costly, and transmitting visual data can raise privacy concerns or even discourage users. To address this problem, embedded machine learning can be used to process visual data locally and transmit only the resulting count to a central server. This work sets out a real-world use case for microcontrollers that are equipped with a camera and an embedded machine learning model for the purpose of counting parked bicycles. A custom dataset was collected and labeled to train an object-detection model, which was subsequently compressed and deployed on an ESP32-S3 microcontroller that processes the image data locally and transmits only the bicycle count to a remote server via LoRaWAN. The model compression incurs only a marginal performance degradation, with the compressed model still achieving an AP@50 of 0.91. Hence, our approach demonstrates the practical realization of recent theoretical advances in tiny machine learning and provides a viable solution for monitoring bicycle parking facilities in real-world settings.
@inproceedings{Stenkampcountingparkedbicycles, title = {Counting Parked Bicycles on the Edge - A TinyML Smart City Application}, author = {Stenkamp, Jan and Hunke, Mathis and Karatas, Cem and Kirchhoff, Steffen and Knaden, Christoph and Naebers, Paul and Zhao, Lige and Karic, Benjamin and Gieseke, Fabian and Herrmann, Nina}, booktitle = {ACM/IEEE International Conference on Embedded Artificial Intelligence and Sensing Systems (SenSys)}, year = {2026}, tags = {ml,application,rs}, projects = {tinyaiot}, doi = {10.1145/3774906.3802788} } -
 K. Schrödter, J. Pauls, and F. GiesekeAISTATS26 Twenty-Ninth Annual Conference on Artificial Intelligence and Statistics (AISTATS) 2026
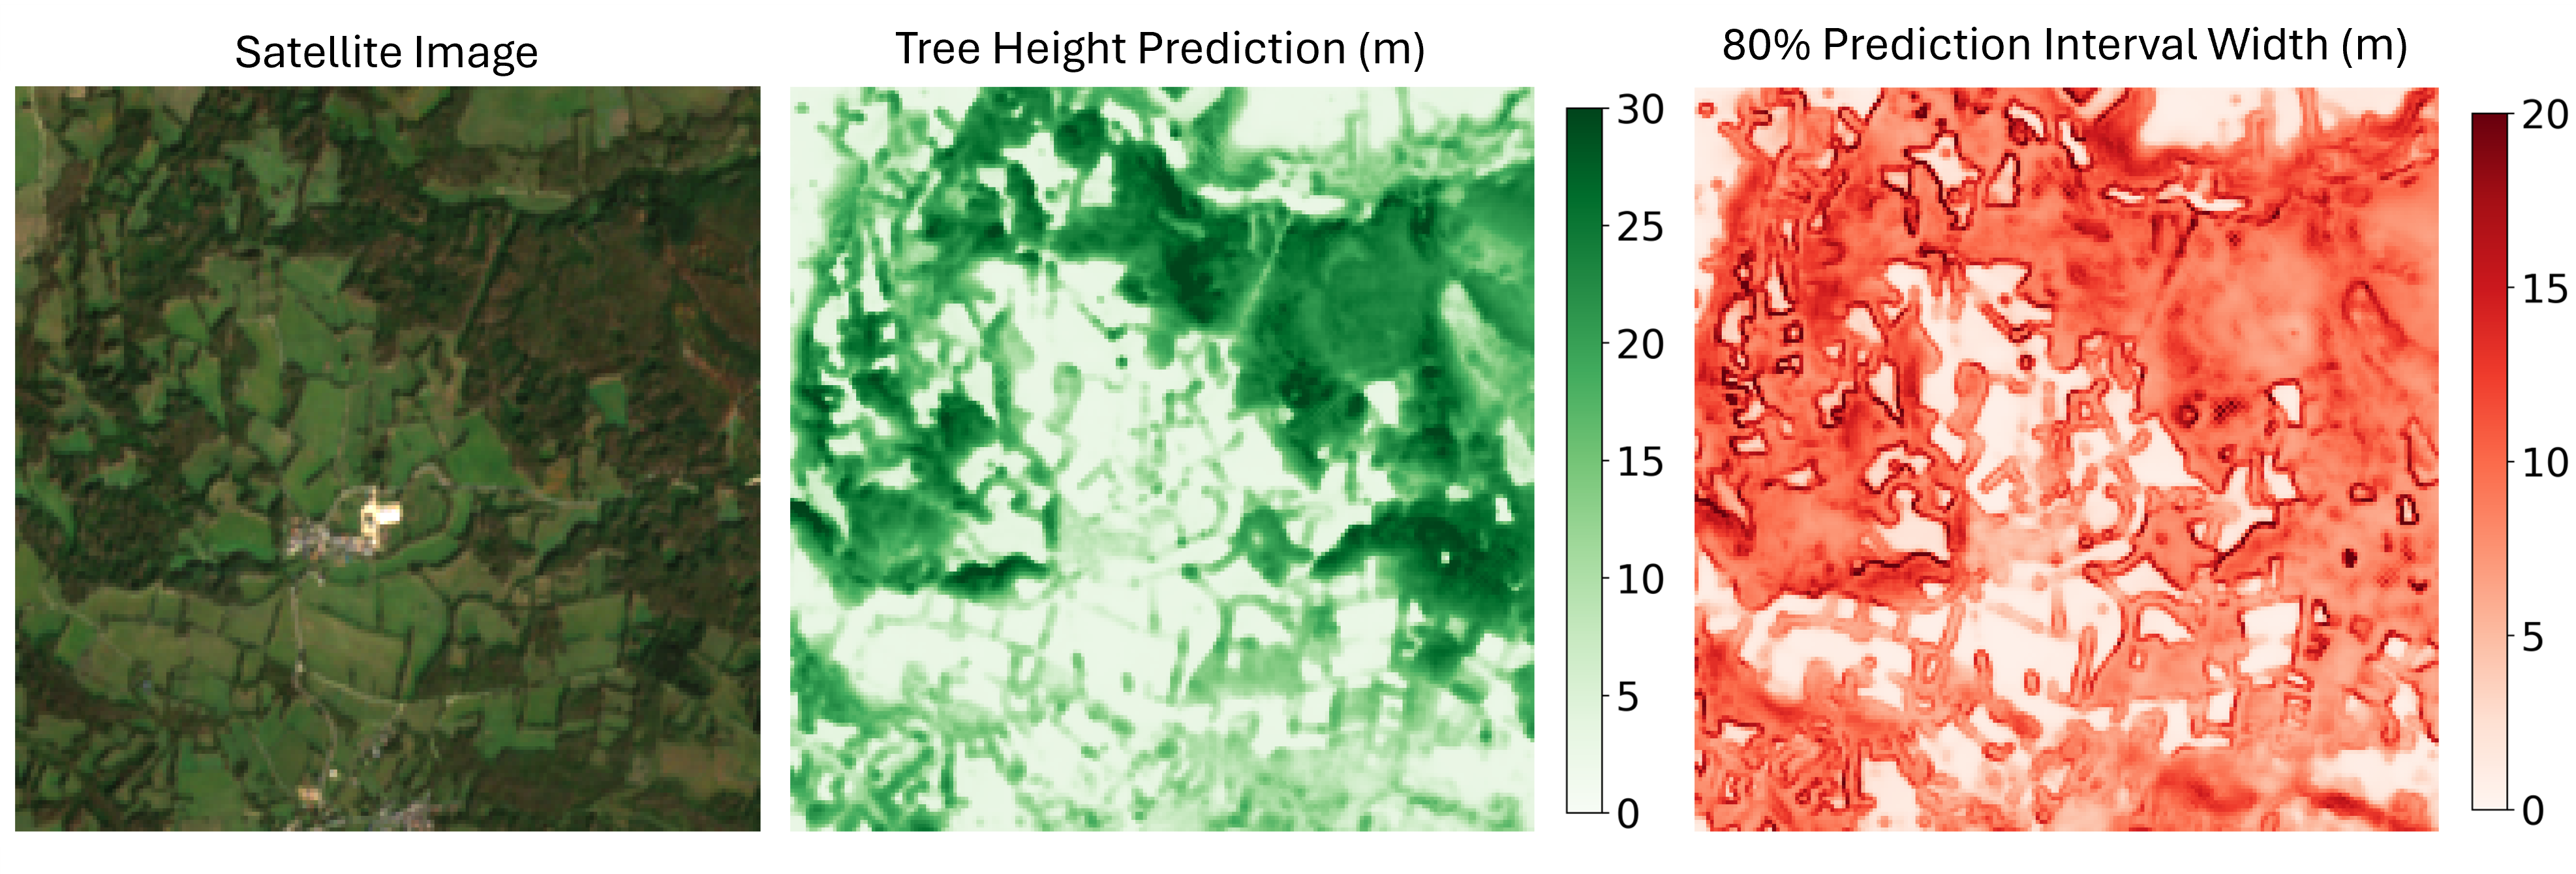
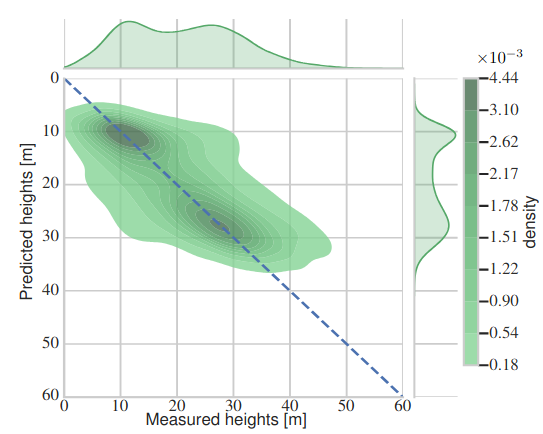
Accurate tree height estimation is vital for ecological monitoring and biomass assessment. We apply quantile regression to existing tree height estimation models based on satellite data to incorporate uncertainty quantification. Most current approaches on tree height estimation rely on point predictions, which limits their applicability in risk-sensitive scenarios. In this work, we show that with minor modifications to the prediction head, existing models can be adapted to provide statistically calibrated uncertainty estimates via quantile regression. Furthermore, we demonstrate how our results correlate with known challenges in remote sensing (e.g., terrain complexity, vegetation heterogeneity), indicating that the model is less confident in more challenging conditions.
@inproceedings{schroedter2026uncertaintytree, title = {Canopy Tree Height Estimation using Quantile Regression: Modeling and Evaluating Uncertainty in Remote Sensing}, author = {Schrödter, Karsten and Pauls, Jan and Gieseke, Fabian}, booktitle = {Twenty-Ninth Annual Conference on Artificial Intelligence and Statistics (AISTATS)}, year = {2026}, tags = {ml,application,rs}, projects = {ai4forest} } -
 M. Schwartz, P. Ciais, E. Sean, A. de Truchis, C. Vega, N. Besic, I. Fayad, J. Wigneron, S. Brood, A. Pelissier-Tanon, J. Pauls, G. Belouze, and Y. XuRemote Sensing of Environment 2025
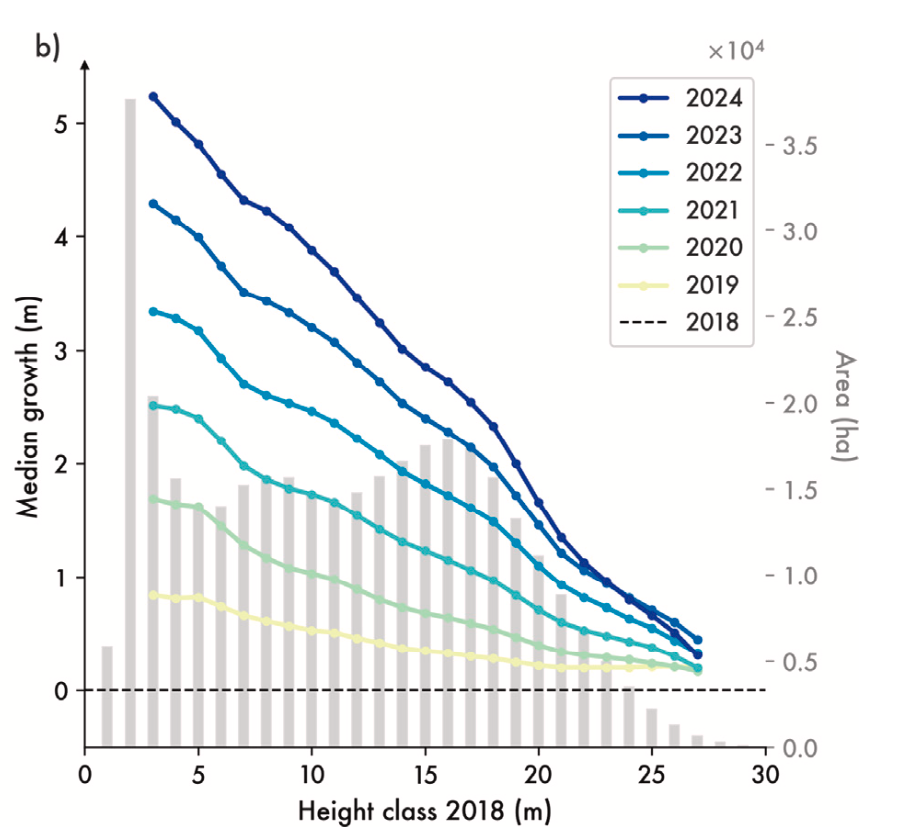
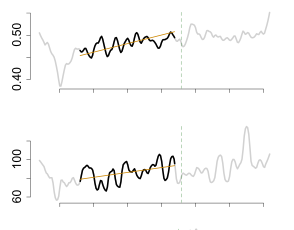
High-resolution mapping of forest attributes is crucial for ecosystem monitoring and carbon budget assessments. Recent advancements have leveraged satellite imagery and deep learning algorithms to generate high-resolution forest height maps. While these maps provide valuable snapshots of forest conditions, they lack the temporal resolution to estimate forest-related carbon fluxes or track annual changes. Few studies have produced annual forest height, volume, or biomass change maps validated at the forest stand level. To address this limitation, we developed a deep learning framework, coupling data from Sentinel-1 (S1), Sentinel-2 (S2) and from the Global Ecosystem Dynamics Investigation (GEDI) mission, to generate a time series of forest height, growing stock volume, and aboveground biomass at 10 to 30-m spatial resolution that we refer to as FORMS-T (FORest Multiple Satellite Time series). Unlike previous studies, we train our model on individual S2 scenes, rather than on growing season composites, to account for acquisition variability and improve generalization across years. We produced these maps for France over seven years (2018–2024) for height at 10 m resolution and further converted them to 30 m maps of growing stock volume and aboveground biomass using leaf type-specific allometric equations. Evaluation against the French National Forest Inventory (NFI) showed an average mean absolute error of 3.07 m for height (r2=0.68) across all years, 86 m3 ha-1 for volume and 65.1 Mg ha-1 for biomass. We further evaluated FORMS-T capacity to capture growth on a site where two successive airborne laser scanning (ALS) campaigns were available, showing a good agreement with ALS data when aggregating at coarser spatial resolution (r2=0.60, MAE=0.27 m for the 2020–2022 growth of trees between 10 and 15 m in 5 km pixels). Additionally, we compared our results to the NFI-based wood volume production at regional level and obtained a good agreement with a MAE of 1.45 m3 ha-1 yr-1 and r2 of 0.59. We then leveraged our height change maps to derive species-specific growth curves and compared them to ground-based measurements, highlighting distinct growth dynamics and regional variations in forest management practices. Further development of such maps could contribute to the assessment of forest-related carbon stocks and fluxes, contributing to the formulation of a comprehensive carbon budget at the country scale, and supporting global efforts to mitigate climate change.
-
 I. Fayad, M. Zimmer, M. Schwartz, P. Ciais, F. Gieseke, G. Belouze, S. Brood, A. De Truchis, and A. d’AspremontICML25 42nd International Conference on Machine Learning (ICML) 2025
Significant efforts have been directed towards adapting self-supervised multimodal learning for Earth observation applications. However, existing methods produce coarse patch-sized embeddings, limiting their effectiveness and integration with other modalities like LiDAR. To close this gap, we present DUNIA, an approach to learn pixel-sized embeddings through cross-modal alignment between images and full-waveform LiDAR data. As the model is trained in a contrastive manner, the embeddings can be directly leveraged in the context of a variety of environmental monitoring tasks in a zero-shot setting. In our experiments, we demonstrate the effectiveness of the embeddings for seven such tasks (canopy height mapping, fractional canopy cover, land cover mapping, tree species identification, plant area index, crop type classification, and per-pixel waveform-based vertical structure mapping). The results show that the embeddings, along with zero-shot classifiers, often outperform specialized supervised models, even in low data regimes. In the fine-tuning setting, we show strong low-shot capabilities with performances near or better than state-of-the-art on five out of six tasks.
@inproceedings{fayad2025dunia, title = {DUNIA: Pixel-Sized Embeddings via Cross-Modal Alignment for Earth Observation Applications}, author = {Fayad, Ibrahim and Zimmer, Max and Schwartz, Martin and Ciais, Philippe and Gieseke, Fabian and Belouze, Gabriel and Brood, Sarah and De Truchis, Aurelien and d'Aspremont, Alexandre}, booktitle = {42nd International Conference on Machine Learning (ICML)}, year = {2025}, tags = {ml,application}, projects = {ai4forest} } -
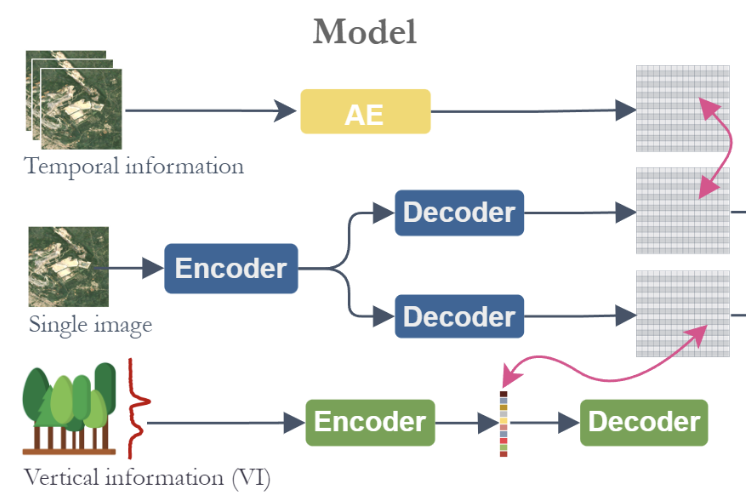
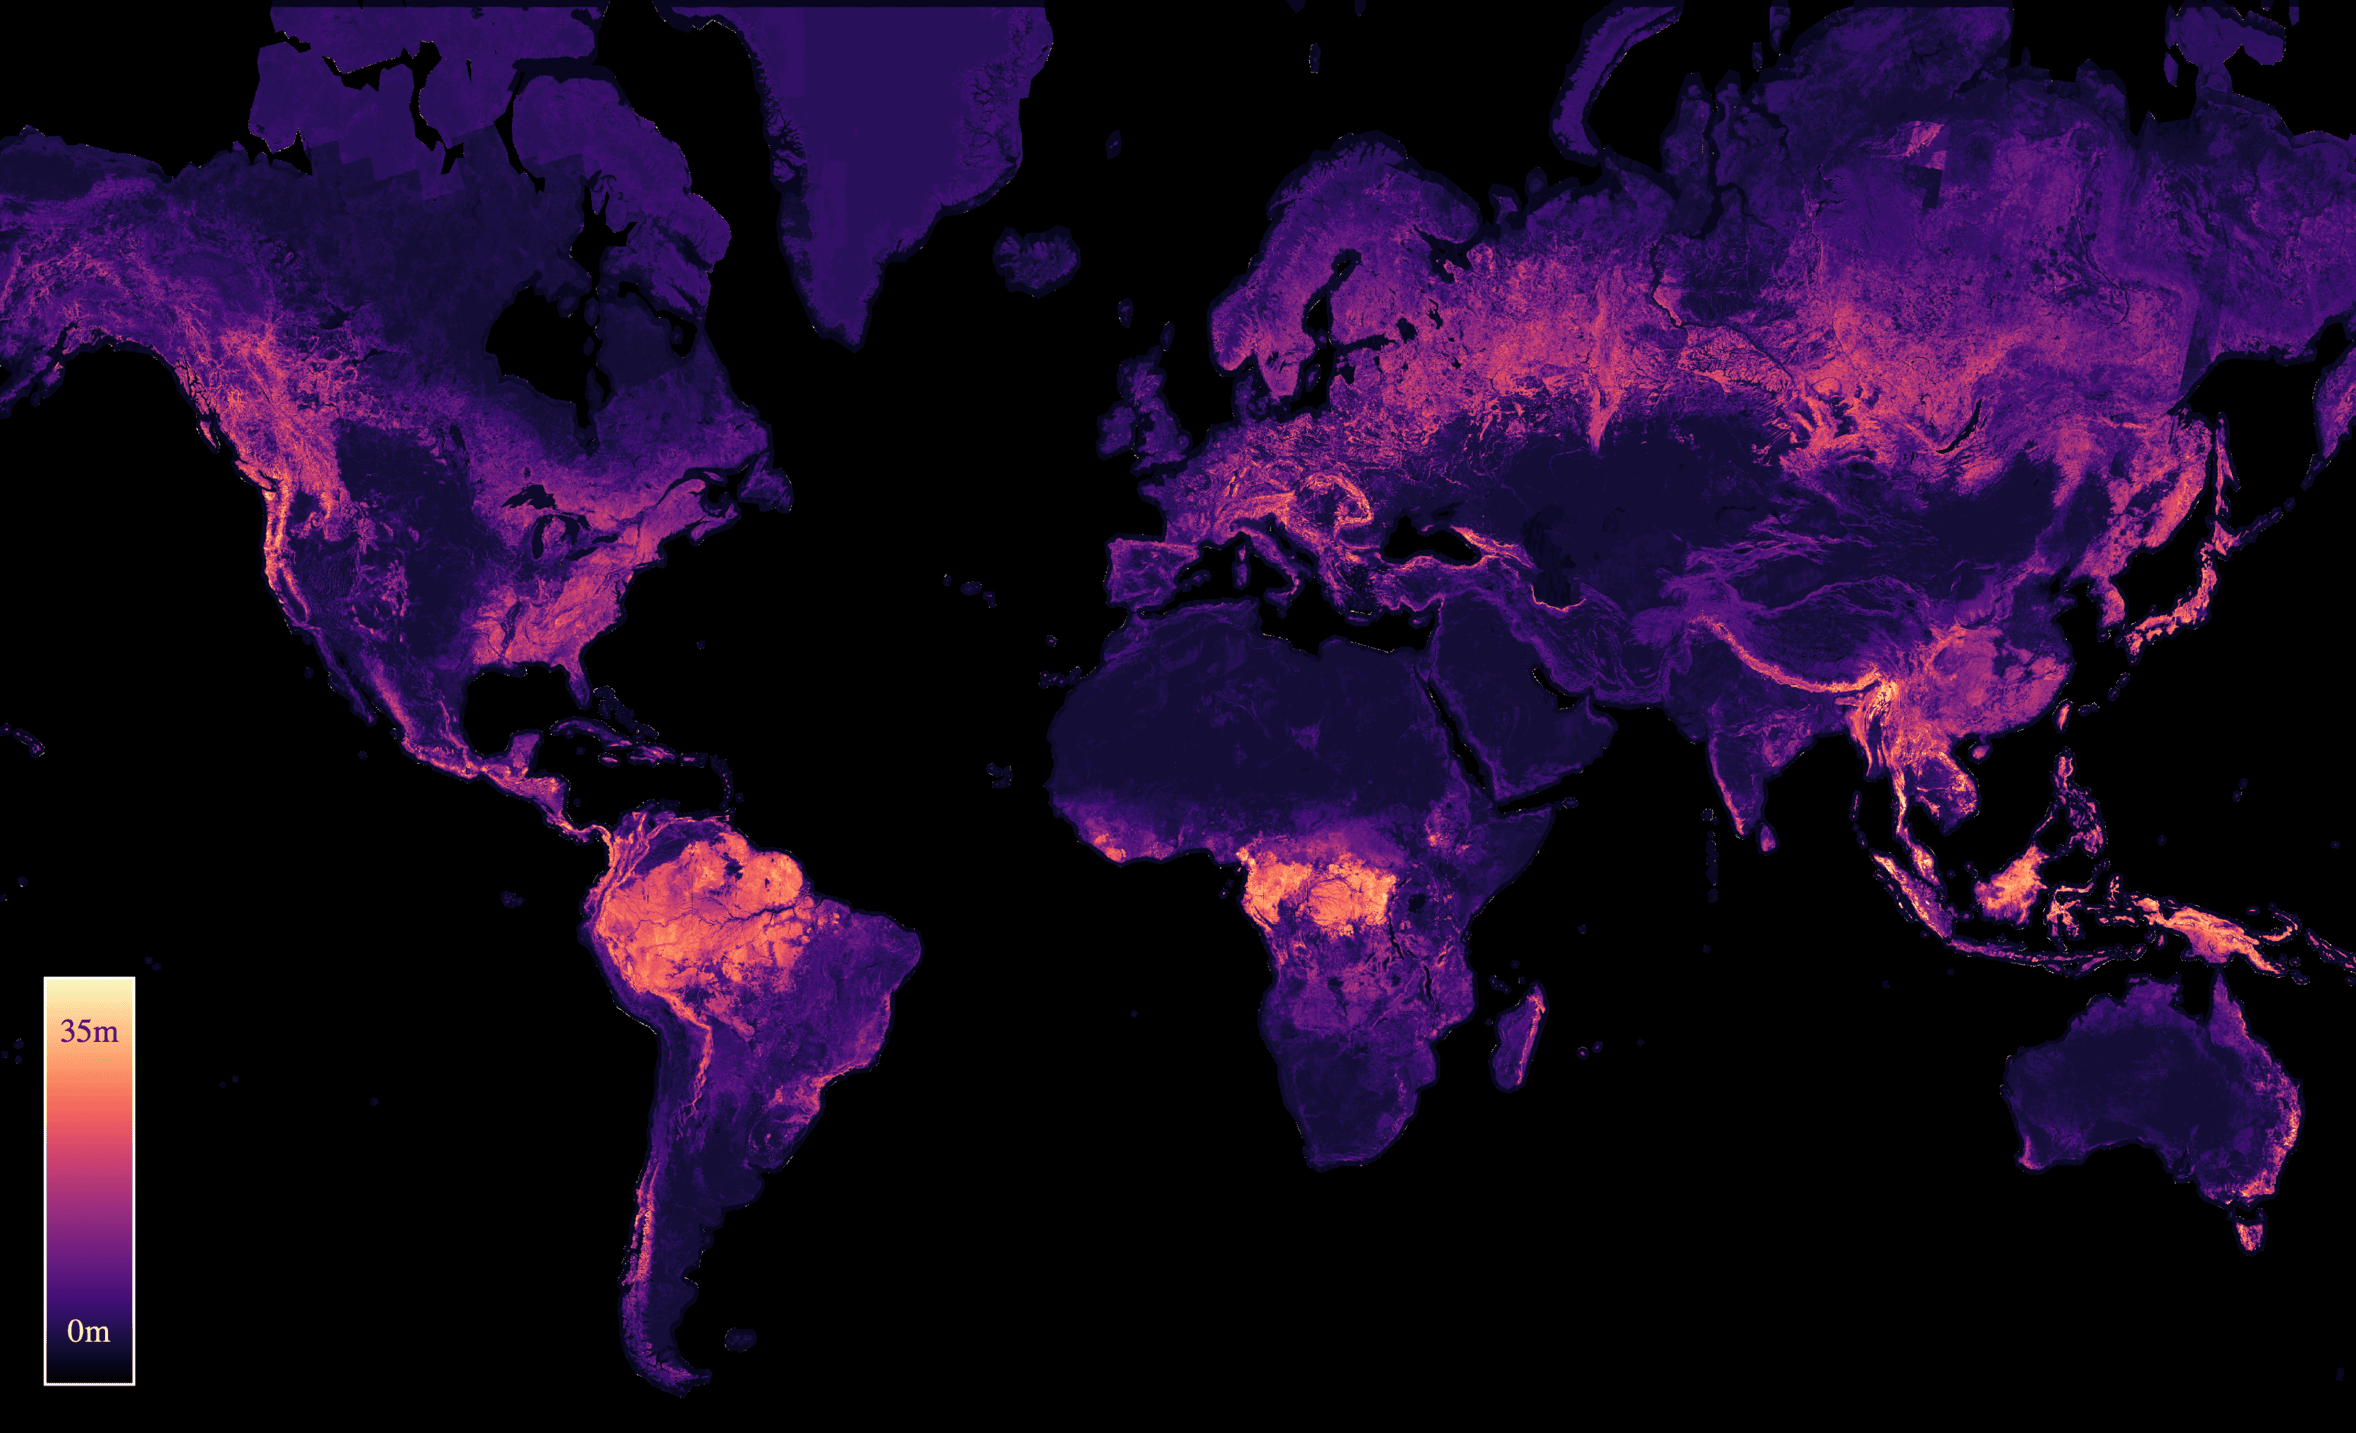
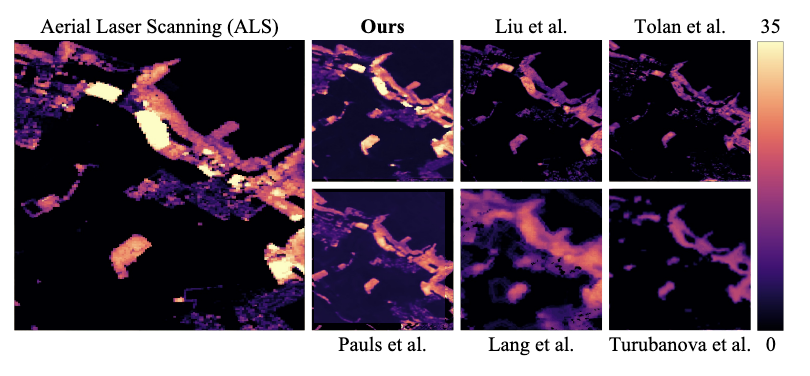 J. Pauls, M. Zimmer, B. Turan, S. Saatchi, P. Ciais, S. Pokutta, and F. GiesekeICML25 42nd International Conference on Machine Learning (ICML) 2025
With the rise in global greenhouse gas emissions, accurate large-scale tree canopy height maps are essential for understanding forest structure, estimating above-ground biomass, and monitoring ecological disruptions. To this end, we present a novel approach to generate large-scale, high-resolution canopy height maps over time. Our model accurately predicts canopy height over multiple years given Sentinel-2 time series satellite data. Using GEDI LiDAR data as the ground truth for training the model, we present the first 10m resolution temporal canopy height map of the European continent for the period 2019-2022. As part of this product, we also offer a detailed canopy height map for 2020, providing more precise estimates than previous studies. Our pipeline and the resulting temporal height map are publicly available, enabling comprehensive large-scale monitoring of forests and, hence, facilitating future research and ecological analyses. For an interactive viewer, see this https URL.
@inproceedings{pauls2025capturing, title = {Capturing Temporal Dynamics in Large-Scale Canopy Tree Height Estimation}, author = {Pauls, Jan and Zimmer, Max and Turan, Berkant and Saatchi, Sassan and Ciais, Philippe and Pokutta, Sebastian and Gieseke, Fabian}, booktitle = {42nd International Conference on Machine Learning (ICML)}, year = {2025}, custom = {Earth Engine|https://europetreemap.projects.earthengine.app/view/temporalcanopyheight}, tags = {ml, application}, projects = {ai4forest} } -
 P. N. Bernardino, W. D. Keersmaecker, S. Horion, R. V. D. Kerchove, S. Lhermitte, R. Fensholt, S. Oehmcke, F. Gieseke, K. V. Meerbeek, C. Abel, J. Verbesselt, and B. SomersJOURNALNature Climate Change 2025
Climate change and human-induced land degradation threaten dryland ecosystems, vital to one-third of the global population and pivotal to inter-annual global carbon fluxes. Early warning systems are essential for guiding conservation, climate change mitigation and alleviating food insecurity in drylands. However, contemporary methods fail to provide large-scale early warnings effectively. Here we show that a machine learning-based approach can predict the probability of abrupt shifts in Sudano–Sahelian dryland vegetation functioning (75.1% accuracy; 76.6% precision) particularly where measures of resilience (temporal autocorrelation) are supplemented with proxies for vegetation and rainfall dynamics and other environmental factors. Regional-scale predictions for 2025 highlight a belt in the south of the study region with high probabilities of future shifts, largely linked to long-term rainfall trends. Our approach can provide valuable support for the conservation and sustainable use of dryland ecosystem services, particularly in the context of climate change projected drying trends.
@article{BernardinoKHKLFOGMAVS2025, author = {Bernardino, Paulo Negri and Keersmaecker, Wanda De and Horion, Stéphanie and Kerchove, Ruben Van De and Lhermitte, Stef and Fensholt, Rasmus and Oehmcke, Stefan and Gieseke, Fabian and Meerbeek, Koenraad Van and Abel, Christin and Verbesselt, Jan and Somers, Ben}, title = {Predictability of abrupt shifts in dryland ecosystem functioning}, journal = {Nature Climate Change}, year = {2025}, volume = {15}, pages = {86--91}, doi = {10.1038/s41558-024-02201-0}, tags = {application,rs}, } -
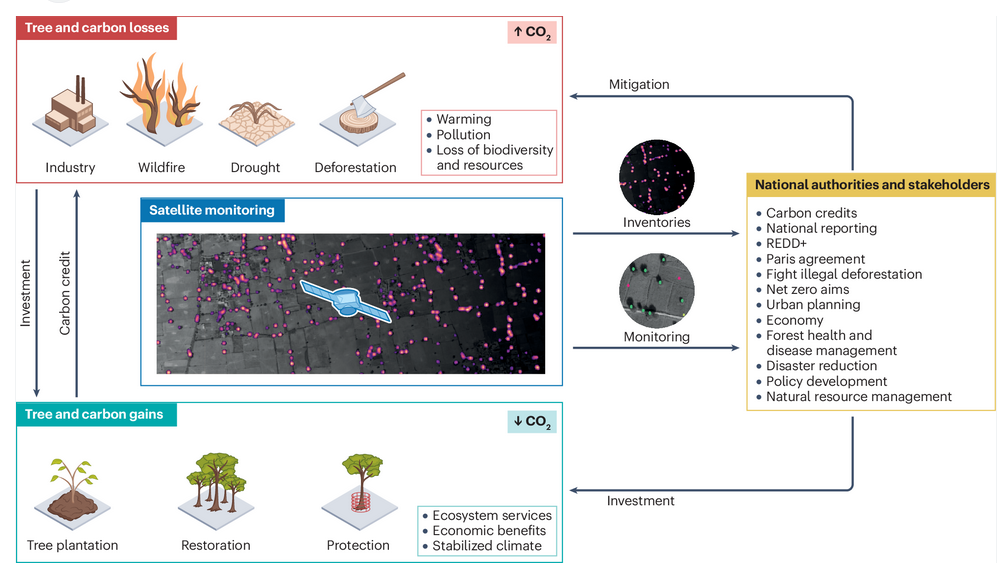 M. Brandt, J. Chave, S. Li, R. Fensholt, P. Ciais, J. Wigneron, F. Gieseke, S. Saatchi, C. J. Tucker, and C. IgelJOURNALNature Reviews Electrical Engineering 2025
Trees contribute to carbon dioxide absorption through biomass, regulate the climate, support biodiversity, enhance soil, air and water quality, and offer economic and health benefits. Traditionally, tree monitoring on continental and global scales has focused on forest cover, whereas assessing biomass and species diversity, as well as trees outside closed-canopy forests, has been challenging. A new generation of commercial and public satellites and sensors provide high-resolution spatial and temporal optical data that can be used to identify trees as objects. Technologies from the field of artificial intelligence, such as convolutional neural networks and vision transformers, can go beyond detecting these objects as two-dimensional representations, and support characterization of the three-dimensional structure of objects, such as canopy height and wood volume, via contextual learning from two-dimensional images. These advancements enable reliable characterization of trees, their structure, biomass and diversity both inside and outside forests. Furthermore, self-supervision and foundation models facilitate large-scale applications without requiring extensive amounts of labels. Here, we summarize these advances, highlighting their application towards consistent tree monitoring systems that can assess carbon stocks, attribute losses and gains to underlying drivers and, ultimately, contribute to climate change mitigation.
@article{BrandtCLFCWGSTI2025HighResolution, author = {Brandt, Martin and Chave, Jerome and Li, Sizhuo and Fensholt, Rasmus and Ciais, Philippe and Wigneron, Jean-Pierre and Gieseke, Fabian and Saatchi, Sassan and Tucker, C. J. and Igel, Christian}, title = {High-resolution sensors and deep learning models for tree resource monitoring}, journal = {Nature Reviews Electrical Engineering}, year = {2025}, volume = {2}, pages = {13--26}, doi = {10.1038/s44287-024-00116-8}, tags = {application,rs}, } - M. Schwartz, P. Ciais, E. Sean, A. de Truchis, C. Vega, N. Besic, I. Fayad, J. Wigneron, S. Brood, A. Pelissier-Tanon, J. Pauls, G. Belouze, and Y. XuRemote Sensing of Environment 2025
High-resolution mapping of forest attributes is crucial for ecosystem monitoring and carbon budget assessments. Recent advancements have leveraged satellite imagery and deep learning algorithms to generate high-resolution forest height maps. While these maps provide valuable snapshots of forest conditions, they lack the temporal resolution to estimate forest-related carbon fluxes or track annual changes. Few studies have produced annual forest height, volume, or biomass change maps validated at the forest stand level. To address this limitation, we developed a deep learning framework, coupling data from Sentinel-1 (S1), Sentinel-2 (S2) and from the Global Ecosystem Dynamics Investigation (GEDI) mission, to generate a time series of forest height, growing stock volume, and aboveground biomass at 10 to 30-m spatial resolution that we refer to as FORMS-T (FORest Multiple Satellite Time series). Unlike previous studies, we train our model on individual S2 scenes, rather than on growing season composites, to account for acquisition variability and improve generalization across years. We produced these maps for France over seven years (2018–2024) for height at 10 m resolution and further converted them to 30 m maps of growing stock volume and aboveground biomass using leaf type-specific allometric equations. Evaluation against the French National Forest Inventory (NFI) showed an average mean absolute error of 3.07 m for height (r2=0.68) across all years, 86 m3 ha-1 for volume and 65.1 Mg ha-1 for biomass. We further evaluated FORMS-T capacity to capture growth on a site where two successive airborne laser scanning (ALS) campaigns were available, showing a good agreement with ALS data when aggregating at coarser spatial resolution (r2=0.60, MAE=0.27 m for the 2020–2022 growth of trees between 10 and 15 m in 5 km pixels). Additionally, we compared our results to the NFI-based wood volume production at regional level and obtained a good agreement with a MAE of 1.45 m3 ha-1 yr-1 and r2 of 0.59. We then leveraged our height change maps to derive species-specific growth curves and compared them to ground-based measurements, highlighting distinct growth dynamics and regional variations in forest management practices. Further development of such maps could contribute to the assessment of forest-related carbon stocks and fluxes, contributing to the formulation of a comprehensive carbon budget at the country scale, and supporting global efforts to mitigate climate change.
-
 J. Pauls, M. Zimmer, U. M. Kelly, M. Schwartz, S. Saatchi, P. Ciais, S. Pokutta, M. Brandt, and F. GiesekeICML24 41st International Conference on Machine Learning (ICML) 2024
We propose a framework for global-scale canopy height estimation based on satellite data. Our model leverages advanced data preprocessing techniques, resorts to a novel loss function designed to counter geolocation inaccuracies inherent in the ground-truth height measurements, and employs data from the Shuttle Radar Topography Mission to effectively filter out erroneous labels in mountainous regions, enhancing the reliability of our predictions in those areas. A comparison between predictions and ground-truth labels yields an MAE / RMSE of 2.43 / 4.73 (meters) overall and 4.45 / 6.72 (meters) for trees taller than five meters, which depicts a substantial improvement compared to existing global-scale maps. The resulting height map as well as the underlying framework will facilitate and enhance ecological analyses at a global scale, including, but not limited to, large-scale forest and biomass monitoring.
@inproceedings{pauls2024estimating, title = {Estimating Canopy Height at Scale}, author = {Pauls, Jan and Zimmer, Max and Kelly, Una M. and Schwartz, Martin and Saatchi, Sassan and Ciais, Philippe and Pokutta, Sebastian and Brandt, Martin and Gieseke, Fabian}, booktitle = {41st International Conference on Machine Learning (ICML)}, year = {2024}, custom = {Earth Engine|https://worldwidemap.projects.earthengine.app/view/canopy-height-2020}, tags = {ml,de,application}, projects = {ai4forest} } -
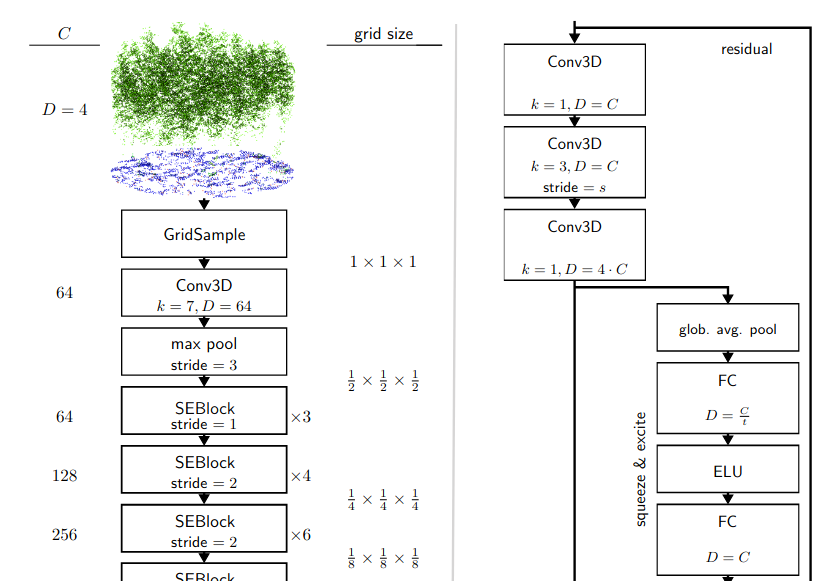
 S. Oehmcke, L. Li, K. Trepekli, J. C. Revenga, T. Nord-Larsen, F. Gieseke, and C. IgelJOURNALRemote Sensing of Environment 2024
Quantifying forest biomass stocks and their dynamics is important for implementing effective climate change mitigation measures by aiding local forest management, studying processes driving af-, re-, and deforestation, and improving the accuracy of carbon accounting. Owing to the 3-dimensional nature of forest structure, remote sensing using airborne LiDAR can be used to perform these measurements of vegetation structure at large scale. Harnessing the full dimensionality of the data, we present deep learning systems predicting wood volume and above ground biomass (AGB) directly from the full LiDAR point cloud and compare results to state-of-the-art approaches operating on basic statistics of the point clouds. For this purpose, we devise different neural network architectures for point cloud regression and evaluate them on remote sensing data of areas for which AGB estimates have been obtained from field measurements in the Danish national forest inventory. Our adaptation of Minkowski convolutional neural networks for regression give the best results. The deep neural networks produce significantly more accurate wood volume, AGB, and carbon stock estimates compared to state-of-the-art approaches. In contrast to other methods, the proposed deep learning approach does not require a digital terrain model and is robust to artifacts along the boundaries of the evaluated areas, which we demonstrate for the case where trees protrude into the area from the outside. We expect this finding to have a strong impact on LiDAR-based analyses of biomass dynamics.
@article{OehmckeLTRNLGI2024DeepPointCloud, author = {Oehmcke, Stefan and Li, Lei and Trepekli, Katerina and Revenga, Jaime C. and Nord-Larsen, Thomas and Gieseke, Fabian and Igel, Christian}, title = {Deep point cloud regression for above-ground forest biomass estimation from airborne LiDAR}, journal = {Remote Sensing of Environment}, year = {2024}, volume = {302}, doi = {10.1016/j.rse.2023.113968}, tags = {rs,ml,application} } -
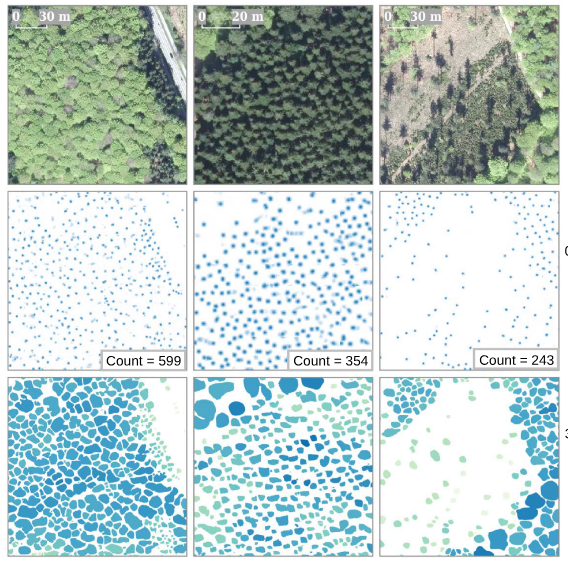 S. Li, M. Brandt, R. Fensholt, A. Kariryaa, C. Igel, F. Gieseke, T. Nord-Larsen, S. Oehmcke, A. H. Carlsen, S. Junttila, X. Tong, A. d’Aspremont, and P. CiaisJOURNALPNAS Nexus 2023
Sustainable tree resource management is the key to mitigating climate warming, fostering a green economy, and protecting valuable habitats. Detailed knowledge about tree resources is a prerequisite for such management but is conventionally based on plot-scale data, which often neglects trees outside forests. Here, we present a deep learning-based framework that provides location, crown area, and height for individual overstory trees from aerial images at country scale. We apply the framework on data covering Denmark and show that large trees (stem diameter >10 cm) can be identified with a low bias (12.5%) and that trees outside forests contribute to 30% of the total tree cover, which is typically unrecognized in national inventories. The bias is high (46.6%) when our results are evaluated against all trees taller than 1.3 m, which involve undetectable small or understory trees. Furthermore, we demonstrate that only marginal effort is needed to transfer our framework to data from Finland, despite markedly dissimilar data sources. Our work lays the foundation for digitalized national databases, where large trees are spatially traceable and manageable.
@article{LiSMRACFTSASXAP2023DeepLearning, author = {Li, Sizhuo and Brandt, Martin and Fensholt, Rasmus and Kariryaa, Ankit and Igel, Christian and Gieseke, Fabian and Nord-Larsen, Thomas and Oehmcke, Stefan and Carlsen, Ask Holm and Junttila, Samuli and Tong, Xiaoye and d’Aspremont, Alexandre and Ciais, Philippe}, title = {Deep learning enables image-based tree counting, crown segmentation, and height prediction at national scale}, journal = {PNAS Nexus}, year = {2023}, volume = {2}, number = {4}, doi = {10.1093/pnasnexus/pgad076}, tags = {rs,application,ml} } -
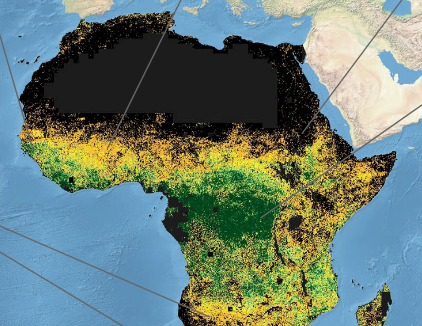 F. Reiner, M. Brandt, X. Tong, D. Skole, A. Kariryaa, P. Ciais, A. Davies, P. Hiernaux, J. Chave, M. Mugabowindekwe, C. Igel, S. Oehmcke, F. Gieseke, S. Li, S. Liu, S. S. Saatchi, P. Boucher, J. Singh, S. Taugourdeau, M. Dendoncker, X. Song, O. Mertz, C. Tucker, and R. FensholtJOURNALNature Communications 2023
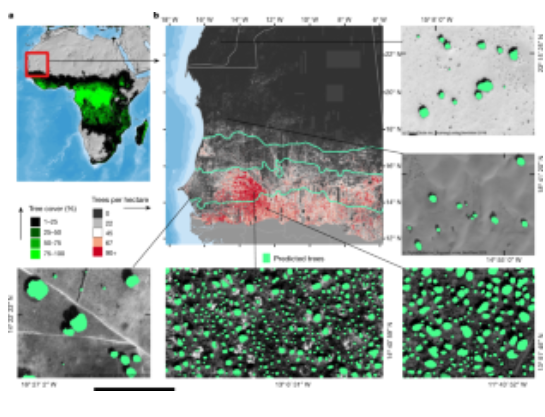
The consistent monitoring of trees both inside and outside of forests is key to sustainable land management. Current monitoring systems either ignore trees outside forests or are too expensive to be applied consistently across countries on a repeated basis. Here we use the PlanetScope nanosatellite constellation, which delivers global very high-resolution daily imagery, to map both forest and non-forest tree cover for continental Africa using images from a single year. Our prototype map of 2019 (RMSE = 9.57%, bias = −6.9%). demonstrates that a precise assessment of all tree-based ecosystems is possible at continental scale, and reveals that 29% of tree cover is found outside areas previously classified as tree cover in state-of-the-art maps, such as in croplands and grassland. Such accurate mapping of tree cover down to the level of individual trees and consistent among countries has the potential to redefine land use impacts in non-forest landscapes, move beyond the need for forest definitions, and build the basis for natural climate solutions and tree-related studies.
@article{ReinerBTSKCDHCMIOGLLSBSTDSMTF2023MoreThanOne, author = {Reiner, Florian and Brandt, Martin and Tong, Xiaoye and Skole, David and Kariryaa, Ankit and Ciais, Philippe and Davies, Andrew and Hiernaux, Pierre and Chave, Jerome and Mugabowindekwe, Maurice and Igel, Christian and Oehmcke, Stefan and Gieseke, Fabian and Li, Sizhuo and Liu, Siyu and Saatchi, Sassan S and Boucher, Peter and Singh, Jenia and Taugourdeau, Simon and Dendoncker, Morgane and Song, Xiao-Peng and Mertz, Ole and Tucker, Compton and Fensholt, Rasmus}, title = {More than one quarter of Africa's tree cover is found outside areas previously classified as forest}, journal = {Nature Communications}, year = {2023}, tags = {rs,application,ml} } -
 S. Oehmcke, L. Li, J. Revenga, T. Nord-Larsen, K. Trepekli, F. Gieseke, and C. IgelSIGSPATIAL22 30th ACM SIGSPATIAL International Conference on Advances in Geographic Information Systems (ACM SIGSPATIAL 2022) 2022
Quantification of forest biomass stocks and their dynamics is important for implementing effective climate change mitigation measures. The knowledge is needed, e.g., for local forest management, studying the processes driving af-, re-, and deforestation, and can improve the accuracy of carbon-accounting. Remote sensing using airborne LiDAR can be used to perform these measurements of vegetation structure at large scale. We present deep learning systems for predicting wood volume, above-ground biomass (AGB), and subsequently above-ground carbon stocks directly from airborne LiDAR point clouds. We devise different neural network architectures for point cloud regression and evaluate them on remote sensing data of areas for which AGB estimates have been obtained from field measurements in the Danish national forest inventory. Our adaptation of Minkowski convolutional neural networks for regression gave the best results. The deep neural networks produced significantly more accurate wood volume, AGB, and carbon stock estimates compared to state-of-the-art approaches operating on basic statistics of the point clouds. In contrast to other methods, the proposed deep learning approach does not require a digital terrain model. We expect this finding to have a strong impact on LiDAR-based analyses of biomass dynamics.
@inproceedings{OehmckeLRNLTGI2022DeepLearning, author = {Oehmcke, Stefan and Li, Lei and Revenga, Jaime and Nord-Larsen, Thomas and Trepekli, Katerina and Gieseke, Fabian and Igel, Christian}, title = {Deep Learning Based 3D Point Cloud Regression for Estimating Forest Biomass}, booktitle = {30th ACM SIGSPATIAL International Conference on Advances in Geographic Information Systems (ACM SIGSPATIAL 2022)}, pages = {1--4}, editor = {Renz, Matthias and Sarwat, Mohamed}, year = {2022}, publisher = {ACM Press}, address = {New York, NY, USA}, doi = {10.1145/3557915.3561471}, tags = {ml,application,rs} } -
 R. N. Masolele, S. V. De, D. Marcos, J. Verbesselt, F. Gieseke, K. A. Mulatu, Y. Moges, H. Sebrala, C. Martius, and M. HeroldJOURNALGIScience and Remote Sensing 2022
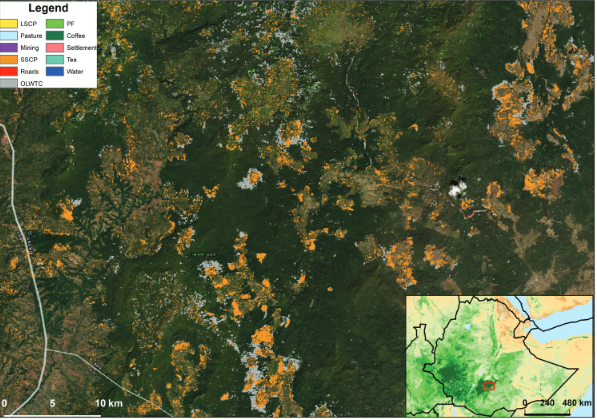
National-scale assessments of post-deforestation land-use are crucial for decreasing deforestation and forest degradation-related emissions. In this research, we assess the potential of different satellite data modalities (single-date, multi-date, multi-resolution, and an ensemble of multi-sensor images) for classifying land-use following deforestation in Ethiopia using the U-Net deep neural network architecture enhanced with attention. We performed the analysis on satellite image data retrieved across Ethiopia from freely available Landsat-8, Sentinel-2 and Planet-NICFI satellite data. The experiments aimed at an analysis of (a) single-date images from individual sensors to account for the differences in spatial resolution between image sensors in detecting land-uses, (b) ensembles of multiple images from different sensors (Planet-NICFI/Sentinel-2/Landsat-8) with different spatial resolutions, (c) the use of multi-date data to account for the contribution of temporal information in detecting land-uses, and, finally, (d) the identification of regional differences in terms of land-use following deforestation in Ethiopia. We hypothesize that choosing the right satellite imagery (sensor) type is crucial for the task. Based on a comprehensive visually interpreted reference dataset of 11 types of post-deforestation land-uses, we find that either detailed spatial patterns (single-date Planet-NICFI) or detailed temporal patterns (multi-date Sentinel-2, Landsat-8) are required for identifying land-use following deforestation, while medium-resolution single-date imagery is not sufficient to achieve high classification accuracy. We also find that adding soft-attention to the standard U-Net improved the classification accuracy, especially for small-scale land-uses. The models and products presented in this work can be used as a powerful data resource for governmental and forest monitoring agencies to design and monitor deforestation mitigation measures and data-driven land-use policy.
@article{MasoleleDMVGMMSMH2022UsingHighResolution, author = {Masolele, Robert N. and De, Sy Veronique and Marcos, Diego and Verbesselt, Jan and Gieseke, Fabian and Mulatu, Kalkidan Ayele and Moges, Yitebitu and Sebrala, Heiru and Martius, Christopher and Herold, Martin}, title = {Using high-resolution imagery and deep learning to classify land-use following deforestation: a case study in Ethiopia}, journal = {GIScience and Remote Sensing}, year = {2022}, volume = {59}, number = {1}, pages = {1446--1472}, doi = {10.1080/15481603.2022.2115619}, tags = {application,rs}, } -
 M. Mugabowindekwe, M. Brandt, J. Chave, F. Reiner, D. Skole, A. Kariryaa, C. Igel, P. Hiernaux, P. Ciais, O. Mertz, X. Tong, S. Li, G. Rwanyiziri, T. Dushimiyimana, A. Ndoli, U. Valens, J. Lillesø, F. Gieseke, C. Tucker, S. S. Saatchi, and R. FensholtJOURNALNature Climate Change 2022
Trees sustain livelihoods and mitigate climate change but a predominance of trees outside forests and limited resources make it difficult for many tropical countries to conduct automated nation-wide inventories. Here, we propose an approach to map the carbon stock of each individual overstory tree at the national scale of Rwanda using aerial imagery from 2008 and deep learning. We show that 72% of the mapped trees are located in farmlands and savannas and 17% in plantations, accounting for 48.6% of the national aboveground carbon stocks. Natural forests cover 11% of the total tree count and 51.4% of the national carbon stocks, with an overall carbon stock uncertainty of 16.9%. The mapping of all trees allows partitioning to any landscapes classification and is urgently needed for effective planning and monitoring of restoration activities as well as for optimization of carbon sequestration, biodiversity and economic benefits of trees.
@article{MugabowindekweBCRSKIHCMTLRDNVLGTSF2022NationWide, author = {Mugabowindekwe, Maurice and Brandt, Martin and Chave, Jerome and Reiner, Florian and Skole, David and Kariryaa, Ankit and Igel, Christian and Hiernaux, Pierre and Ciais, Philippe and Mertz, Ole and Tong, Xiaoye and Li, Sizhuo and Rwanyiziri, Gaspard and Dushimiyimana, Thaulin and Ndoli, Alain and Valens, Uwizeyimana and Lillesø, Jens-Peter and Gieseke, Fabian and Tucker, Compton and Saatchi, Sassan S and Fensholt, Rasmus}, title = {Nation-wide mapping of tree-level aboveground carbon stocks in Rwanda}, journal = {Nature Climate Change}, year = {2022}, volume = {13}, doi = {10.1038/s41558-022-01544-w}, tags = {application,rs}, } -
 J. C. Revenga, K. Trepekli, S. Oehmcke, R. Jensen, L. Li, C. Igel, F. Gieseke, and T. FriborgJOURNALRemote Sensing (Remote Sens.) 2022
Current endeavors to enhance the accuracy of in situ above-ground biomass (AGB) prediction for croplands rely on close-range monitoring surveys that use unstaffed aerial vehicles (UAVs) and mounted sensors. In precision agriculture, light detection and ranging (LiDAR) technologies are currently used to monitor crop growth, plant phenotyping, and biomass dynamics at the ecosystem scale. In this study, we utilized a UAV–LiDAR sensor to monitor two crop fields and a set of machine learning (ML) methods to predict real-time AGB over two consecutive years in the region of Mid-Jutland, Denmark. During each crop growing period, UAV surveys were conducted in parallel with AGB destructive sampling every 7–15 days, the AGB samples from which were used as the ground truth data. We evaluated the ability of the ML models to estimate the real-time values of AGB at a sub-meter resolution (0.17–0.52 m2). An extremely randomized trees (ERT) regressor was selected for the regression analysis, based on its predictive performance for the first year’s growing season. The model was retrained using previously identified hyperparameters to predict the AGB of the crops in the second year. The ERT performed AGB estimation using height and reflectance metrics from LiDAR-derived point cloud data and achieved a prediction performance of 𝑅2 = 0.48 at a spatial resolution of 0.35 m2. The prediction performance could be improved significantly by aggregating adjacent predictions (𝑅2 = 0.71 and 𝑅2 = 0.93 at spatial resolutions of 1 m2 and 2 m2, respectively) as they ultimately converged to the reference biomass values because any individual errors averaged out. The AGB prediction results were examined as function of predictor type, training set size, sampling resolution, phenology, and canopy density. The results demonstrated that when combined with ML regression methods, the UAV–LiDAR method could be used to provide accurate real-time AGB prediction for crop fields at a high resolution, thereby providing a way to map their biochemical constituents.
@article{RevengaTOJLIGF2022AboveGround, author = {Revenga, Jaime C. and Trepekli, Katerina and Oehmcke, Stefan and Jensen, Rasmus and Li, Lei and Igel, Christian and Gieseke, Fabian and Friborg, Thomas}, title = {Above-Ground Biomass Prediction for Croplands at a Sub-Meter Resolution Using UAV–LiDAR and Machine Learning Methods}, journal = {Remote Sensing (Remote Sens.)}, year = {2022}, volume = {14}, number = {16}, pages = {3912}, doi = {10.3390/rs14163912}, tags = {application,rs} } -
 S. Oehmcke, T. Nyegaard-Signori, K. Grogan, and F. GiesekeIEEE BIGDATA 2021 2021 IEEE International Conference on Big Data (Big Data) 2021
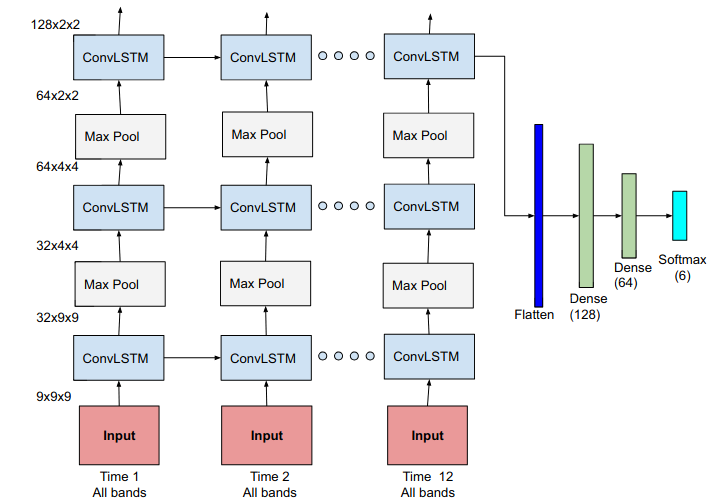
Canopy height is a vital indicator to asses carbon uptake and productivity of forests. However, precise measurements, such as from airborne or spaceborne 3D laser scanning (LiDAR), are expensive and usually cover only small areas. In this work, we propose a novel deep learning model that can generate detailed maps of tree canopy heights. In contrast to previous approaches that use a single image as input, we process multi-temporal data via a an adaptation of the popular U-Net architecture that is based on the EfficientNet and 3D convolution operators. To that end, our model receives multi-spectral Landsat satellite imagery as input and can predict continuous height maps. As labeled data, we resort to spatially sparse LiDAR data from ICESat-2. Thus, with such a model, one can produce dense canopy height maps given only multi-spectral Landsat data. Our experimental evaluation shows that our our model outperforms existing and improved single-temporal models. To test generalizability, we created a non-overlapping dataset to evaluate our approach and further tested the model performance on out-of-distribution data. The results show that our model can successfully learn drastic changes in distribution.
@inproceedings{OehmckeNSGG2021Estimating, author = {Oehmcke, Stefan and Nyegaard-Signori, Thomas and Grogan, Kenneth and Gieseke, Fabian}, title = {Estimating Forest Canopy Height With Multi-Spectral and Multi-Temporal Imagery Using Deep Learning}, booktitle = {2021 {IEEE} International Conference on Big Data (Big Data)}, pages = {4915--4924}, editor = {Chen, Yixin and Ludwig, Heiko and Tu, Yicheng and Fayyad, Usama M. and Zhu, Xingquan and Hu, Xiaohua and Byna, Suren and Liu, Xiong and Zhang, Jianping and Pan, Shirui and Papalexakis, Vagelis and Wang, Jianwu and Cuzzocrea, Alfredo and Ordonez, Carlos}, year = {2021}, publisher = {Wiley-IEEE Press}, address = {Orlando, US}, doi = {10.1109/BigData52589.2021.9672018}, tags = {application,rs}, } -
 R. N. Masolele, V. De Sy, M. Herold, D. Marcos, J. Verbesselt, F. Gieseke, A. G. Mullissa, and C. MartiusJOURNALRemote Sensing of Environment 2021
Assessing land-use following deforestation is vital for reducing emissions from deforestation and forest degradation. In this paper, for the first time, we assess the potential of spatial, temporal and spatio-temporal deep learning methods for large-scale classification of land-use following tropical deforestation using dense satellite time series over six years on the pan-tropical scale (incl. Latin America, Africa, and Asia). Based on an extensive reference database of six forest to land-use conversion types, we find that the spatio-temporal models achieved a substantially higher F1-score accuracies than models that account only for spatial or temporal patterns. Although all models performed better when the scope of the problem was limited to a single continent, the spatial models were more competitive than the temporal ones in this setting. These results suggest that the spatial patterns of land-use within a continent share more commonalities than the temporal patterns and the spatial patterns across continents. This work explores the feasibility of extending and complementing previous efforts for characterizing follow-up land-use after deforestation at a small-scale via human visual interpretation of high resolution RGB imagery. It supports the usage of fast and automated large-scale land-use classification and showcases the value of deep learning methods combined with spatio-temporal satellite data to effectively address the complex tasks of identifying land-use following deforestation in a scalable and cost effective manner.
@article{MasoleleDHMVGMM2021SpatialAnd, author = {Masolele, Robert N. and {De Sy}, Veronique and Herold, Martin and Marcos, Diego and Verbesselt, Jan and Gieseke, Fabian and Mullissa, Adugna G. and Martius, Christopher}, title = {Spatial and temporal deep learning methods for deriving land-use following deforestation: A pan-tropical case study using Landsat time series}, journal = {Remote Sensing of Environment}, year = {2021}, volume = {264}, pages = {112600}, doi = {10.1016/j.rse.2021.112600}, tags = {application,rs}, } -
 S. Oehmcke, T. K. Chen, A. V. Prishchepov, and F. GiesekeBIGSPATIAL20 Proceedings of the 9th ACM SIGSPATIAL International Workshop on Analytics for Big Geospatial Data 2020
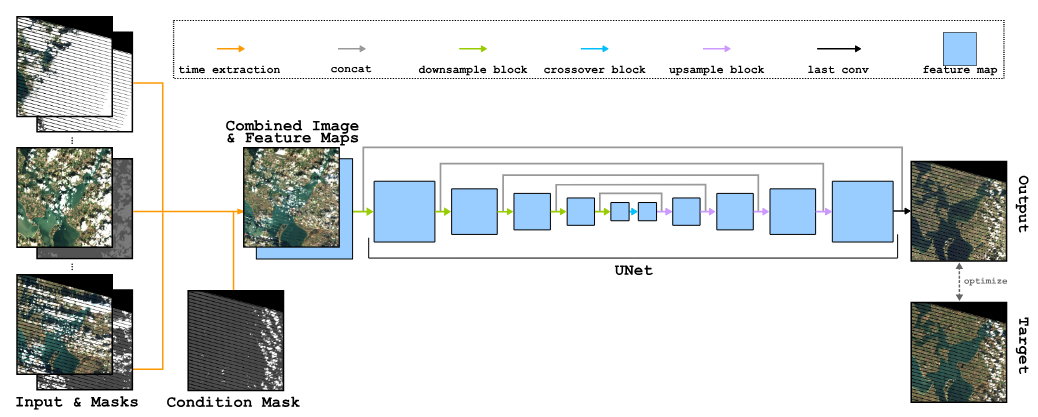
Optical satellite images are important for environmental monitoring. Unfortunately, such images are often affected by distortions, such as clouds, shadows, or missing data. This work proposes a deep learning approach for cleaning and imputing satellite images, which could serve as a reliable preprocessing step for spatial and spatio-temporal analyzes. More specifically, a coherent and cloud-free image for a specific target date and region is created based on a sequence of images of that region obtained at previous dates. Our model first extracts information from the previous time steps via a special gating function and then resorts to a modified version of the well-known U-Net architecture to obtain the desired output image. The model uses supplementary data, namely the approximate cloud coverage of input images, the temporal distance to the target time, and a missing data mask for each input time step. During the training phase we condition our model with the targets cloud coverage and missing values (disabled in production), which allows us to use data afflicted by distortion during training and thus does not require pre-selection of distortion-free data. Our experimental evaluation, conducted on data of the Landsat missions, shows that our approach outperforms the commonly utilized approach that resorts to taking the median of cloud-free pixels for a given position. This is especially the case when the quality of the data for the considered period is poor (e.g., lack of cloud free-images during the winter/fall periods). Our deep learning approach allows to improve the utility of the entire Landsat archive, the only existing global medium-resolution free-access satellite archive dating back to the 1970s. It therefore holds scientific and societal potential for future analyses conducted on data from this and other satellite imagery repositories.
@inproceedings{OehmckeTHPG2020CreatingCloudFree, author = {Oehmcke, Stefan and Chen, Tzu-Hsin Karen and Prishchepov, Alexander V. and Gieseke, Fabian}, title = {Creating Cloud-Free Satellite Imagery from Image Time Series with Deep Learning}, booktitle = {Proceedings of the 9th ACM SIGSPATIAL International Workshop on Analytics for Big Geospatial Data}, pages = {3:1-3:10}, year = {2020}, publisher = {ACM}, address = {Seattle, USA}, doi = {10.1145/3423336.3429345}, tags = {ml,de,rs,application}, } -
 M. Brandt, C. Tucker, A. Kariryaa, K. Rasmussen, C. Abel, J. Small, J. Chave, L. Rasmussen, P. Hiernaux, A. Diouf, L. Kergoat, O. Mertz, C. Igel, F. Gieseke, J. Schöning, S. Li, K. Melocik, J. Meyer, SinnoS, E. Romero, E. Glennie, A. Montagu, M. Dendoncker, and R. FensholtJOURNALNature 2020
A large proportion of dryland trees and shrubs (hereafter referred to collectively as trees) grow in isolation, without canopy closure. These non-forest trees have a crucial role in biodiversity, and provide ecosystem services such as carbon storage, food resources and shelter for humans and animals. However, most public interest relating to trees is devoted to forests, and trees outside of forests are not well-documented. Here we map the crown size of each tree more than 3 m2 in size over a land area that spans 1.3 million km2 in the West African Sahara, Sahel and sub-humid zone, using submetre-resolution satellite imagery and deep learning. We detected over 1.8 billion individual trees (13.4 trees per hectare), with a median crown size of 12 m2, along a rainfall gradient from 0 to 1,000 mm per year. The canopy cover increases from 0.1% (0.7 trees per hectare) in hyper-arid areas, through 1.6% (9.9 trees per hectare) in arid and 5.6% (30.1 trees per hectare) in semi-arid zones, to 13.3% (47 trees per hectare) in sub-humid areas. Although the overall canopy cover is low, the relatively high density of isolated trees challenges prevailing narratives about dryland desertification, and even the desert shows a surprisingly high tree density. Our assessment suggests a way to monitor trees outside of forests globally, and to explore their role in mitigating degradation, climate change and poverty.
@article{BrandtTKRASCRHDKMIGSLMMSRGMDF2020AnUnexpectedly, author = {Brandt, M and Tucker, C and Kariryaa, A and Rasmussen, K and Abel, C and Small, J and Chave, J and Rasmussen, L and Hiernaux, P and Diouf, A and Kergoat, L and Mertz, O and Igel, C and Gieseke, F and Schöning, J and Li, S and Melocik, K and Meyer, J and SinnoS and Romero, E and Glennie, E and Montagu, A and Dendoncker, M and Fensholt, R}, title = {An unexpectedly large count of trees in the West African Sahara and Sahel}, journal = {Nature}, year = {2020}, volume = {2020}, doi = {10.1038/s41586-020-2824-5}, tags = {application,rs,ml} } -
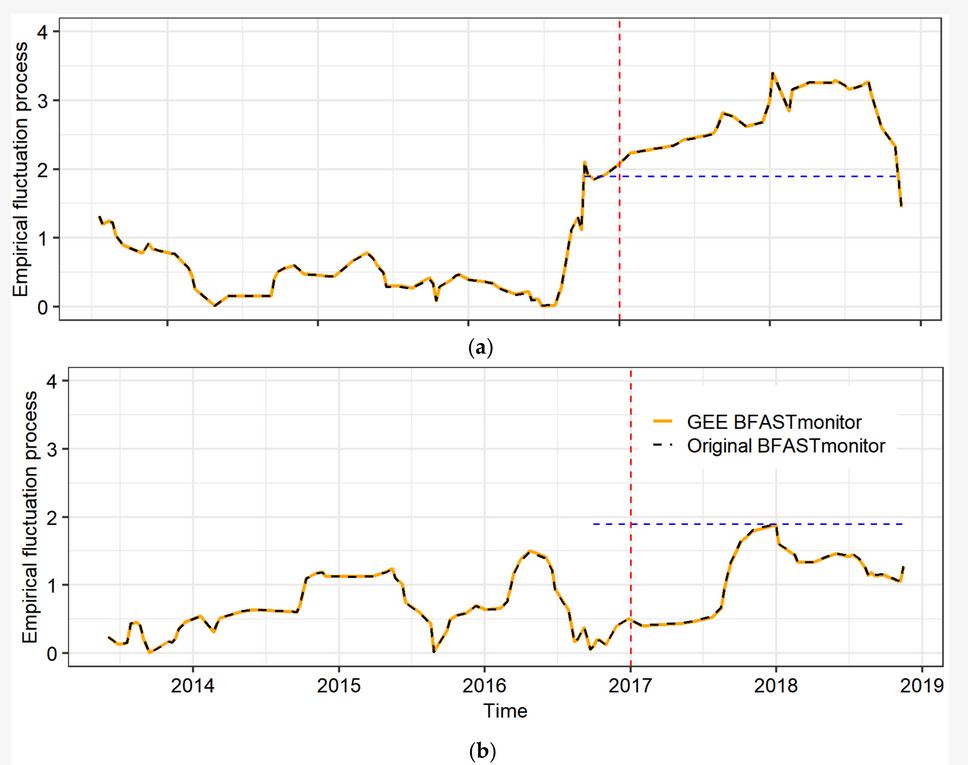 E. Hamunyela, S. Rosca, A. Mirt, E. Engle, M. Herold, F. Gieseke, and J. Verbesselt.JOURNALRemote Sensing 2020
Monitoring of abnormal changes on the earth’s surface (e.g., forest disturbance) has improved greatly in recent years because of satellite remote sensing. However, high computational costs inherently associated with processing and analysis of satellite data often inhibit large-area and sub-annual monitoring. Normal seasonal variations also complicate the detection of abnormal changes at sub-annual scale in the time series of satellite data. Recently, however, computationally powerful platforms, such as the Google Earth Engine (GEE), have been launched to support large-area analysis of satellite data. Change detection methods with the capability to detect abnormal changes in time series data while accounting for normal seasonal variations have also been developed but are computationally intensive. Here, we report an implementation of BFASTmonitor (Breaks For Additive Season and Trend monitor) on GEE to support large-area and sub-annual change monitoring using satellite data available in GEE. BFASTmonitor is a data-driven unsupervised change monitoring approach that detects abnormal changes in time series data, with near real-time monitoring capabilities. Although BFASTmonitor has been widely used in forest cover loss monitoring, it is a generic change monitoring approach that can be used to monitor changes in a various time series data. Using Landsat time series for normalised difference moisture index (NDMI), we evaluated the performance of our GEE BFASTmonitor implementation (GEE BFASTmonitor) by detecting forest disturbance at three forest areas (humid tropical forest, dry tropical forest, and miombo woodland) while comparing it to the original R-based BFASTmonitor implementation (original BFASTmonitor). A map-to-map comparison showed that the spatial and temporal agreements on forest disturbance between the original and our GEE BFASTmonitor implementations were high. At each site, the spatial agreement was more than 97%, whereas the temporal agreement was over 94%. The high spatial and temporal agreement show that we have properly translated and implemented the BFASTmonitor algorithm on GEE. Naturally, due to different numerical solvers being used for regression model fitting in R and GEE, small differences could be observed in the outputs. These differences were most noticeable at the dry tropical forest and miombo woodland sites, where the forest exhibits strong seasonality. To make GEE BFASTmonitor accessible to non-technical users, we developed a web application with simplified user interface. We also created a JavaScript-based GEE BFASTmonitor package that can be imported as a module. Overall, our GEE BFASTmonitor implementation fills an important gap in large-area environmental change monitoring using earth observation data.
@article{HamunyelaRMEHGV2020Implementation, author = {Hamunyela, Eliakim and Rosca, Sabina and Mirt, Andrei and Engle, Eric and Herold, Martin and Gieseke, Fabian and Verbesselt., Jan}, title = {Implementation of BFASTmonitor Algorithm on Google Earth Engine to Support Large-Area and Sub-Annual Change Monitoring Using Earth Observation Data}, journal = {Remote Sensing}, year = {2020}, volume = {12}, number = {18}, doi = {10.3390/rs12182953}, tags = {application,rs} } -
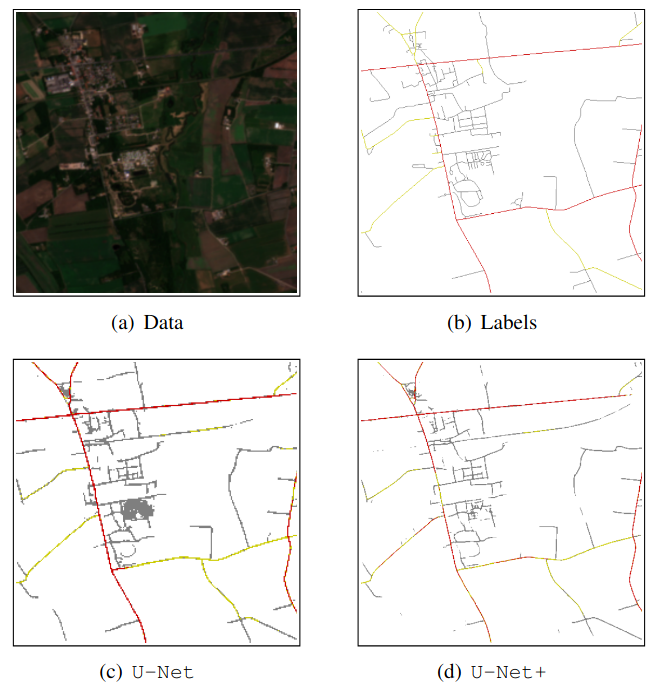 S. Oehmcke, C. Thrysøe, A. Borgstad, M. V. Salles, M. Brandt, and F. GiesekeIEEE BIGDATA 2019 2019 IEEE International Conference on Big Data (IEEE BigData) 2019
Massive amounts of satellite data have been gathered over time, holding the potential to unveil a spatiotemporal chronicle of the surface of Earth. These data allow scientists to investigate various important issues, such as land use changes, on a global scale. However, not all land-use phenomena are equally visible on satellite imagery. In particular, the creation of an inventory of the planet’s road infrastructure remains a challenge, despite being crucial to analyze urbanization patterns and their impact. Towards this end, this work advances data-driven approaches for the automatic identification of roads based on open satellite data. Given the typical resolutions of these historical satellite data, we observe that there is inherent variation in the visibility of different road types. Based on this observation, we propose two deep learning frameworks that extend state-of-the-art deep learning methods by formalizing road detection as an ordinal classification task. In contrast to related schemes, one of the two models also resorts to satellite time series data that are potentially affected by missing data and cloud occlusion. Taking these time series data into account eliminates the need to manually curate datasets of high-quality image tiles, substantially simplifying the application of such models on a global scale. We evaluate our approaches on a dataset that is based on Sentinel 2 satellite imagery and OpenStreetMap vector data. Our results indicate that the proposed models can successfully identify large and medium-sized roads. We also discuss opportunities and challenges related to the detection of roads and other infrastructure on a global scale.
@inproceedings{OehmckeTBMBG2019DetectingHardly, author = {Oehmcke, Stefan and Thrysøe, Christoph and Borgstad, Andreas and Salles, Marcos Vaz and Brandt, Martin and Gieseke, Fabian}, title = {Detecting Hardly Visible Roads in Low-Resolution Satellite Time Series Data}, booktitle = {2019 {IEEE} International Conference on Big Data {(IEEE} BigData)}, pages = {2403--2412}, year = {2019}, publisher = {IEEE}, doi = {10.1109/BigData47090.2019.9006251}, tags = {ml,application,rs}, } -
 A. D’Isanto, S. Cavuoti, F. Gieseke, and K. L. PolstererAstronomy & Astrophysics 2018
The explosion of data in recent years has generated an increasing need for new analysis techniques in order to extract knowledge from massive datasets. Machine learning has proved particularly useful to perform this task. Fully automatized methods have recently gathered great popularity, even though those methods often lack physical interpretability. In contrast, feature based approaches can provide both well-performing models and understandable causalities with respect to the correlations found between features and physical processes. Efficient feature selection is an essential tool to boost the performance of machine learning models. In this work, we propose a forward selection method in order to compute, evaluate, and characterize better performing features for regression and classification problems. Given the importance of photometric redshift estimation, we adopt it as our case study. We synthetically created 4,520 features by combining magnitudes, errors, radii, and ellipticities of quasars, taken from the SDSS. We apply a forward selection process, a recursive method in which a huge number of feature sets is tested through a kNN algorithm, leading to a tree of feature sets. The branches of the tree are then used to perform experiments with the random forest, in order to validate the best set with an alternative model. We demonstrate that the sets of features determined with our approach improve the performances of the regression models significantly when compared to the performance of the classic features from the literature. The found features are unexpected and surprising, being very different from the classic features. Therefore, a method to interpret some of the found features in a physical context is presented. The methodology described here is very general and can be used to improve the performance of machine learning models for any regression or classification task.
@article{DIsantoCGP2018ReturnOfThe, author = {D'Isanto, Antonio and Cavuoti, Stefano and Gieseke, Fabian and Polsterer, Kai Lars}, title = {Return of the features --- Efficient feature selection and interpretation for photometric redshifts}, journal = {Astronomy & Astrophysics}, year = {2018}, volume = {616}, pages = {A97}, doi = {10.1051/0004-6361/201833103}, tags = {application}, } -
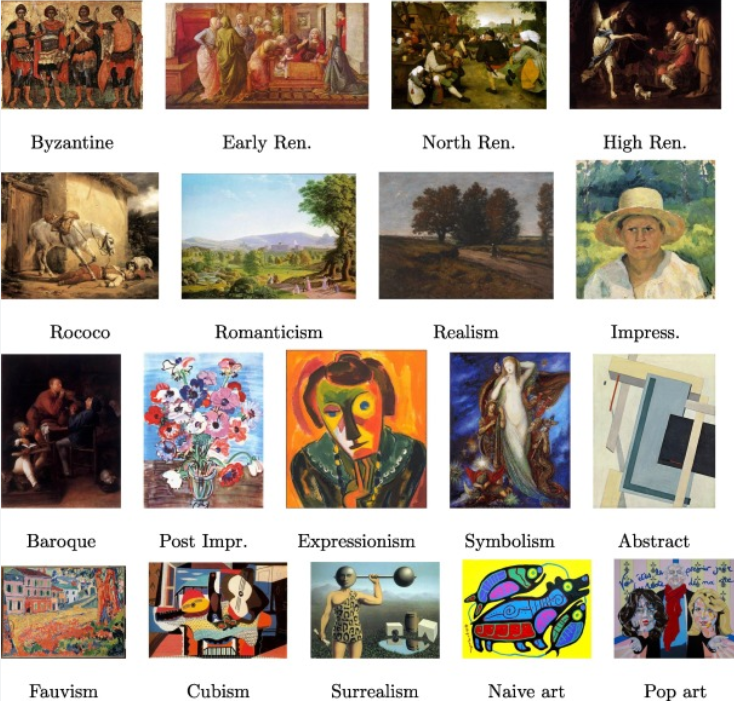 C. Florea, and F. GiesekeJournal of Visual Communication and Image Representation 2018
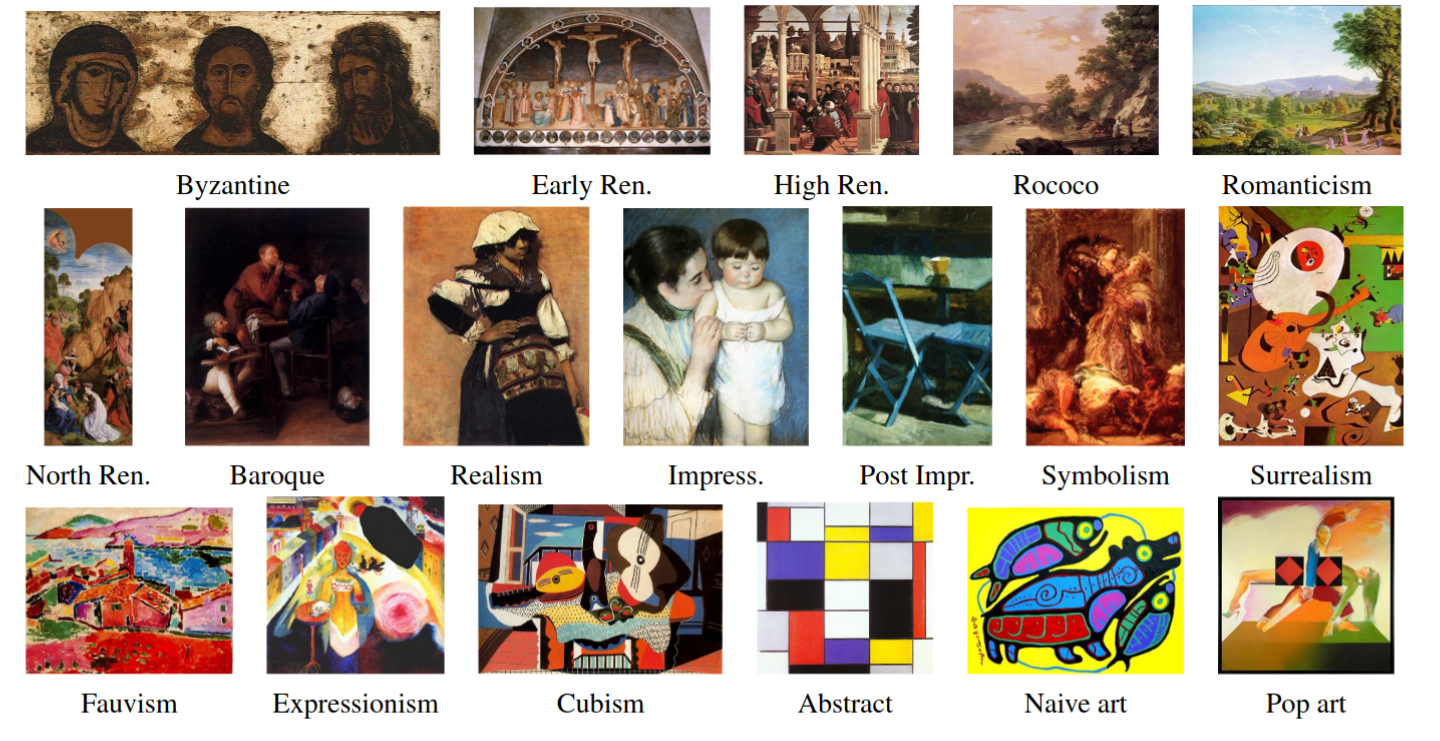
In this work we aim to automatically recognize the artistic movement from a digitized image of a painting. Our approach uses a new system that resorts to descriptions induced by color structure histograms and by novel topographical features for texture assessment. The topographical descriptors accumulate information from the first and second local derivatives within four layers of finer representations. The classification is performed by two layers of ensembles. The first is an adapted boosted ensemble of support vector machines, which introduces further randomization over feature categories as a regularization. The training of the ensemble yields individual experts by isolating initially misclassified images and by correcting them in further stages of the process. The solution improves the performance by a second layer build upon the consensus of multiple local experts that analyze different parts of the images. The resulting performance compares favorably with classical solutions and manages to match the ones of modern deep learning frameworks.
@article{FloreaG2018ArtisticMovement, author = {Florea, Corneliu and Gieseke, Fabian}, title = {Artistic movement recognition by consensus of boosted SVM based experts}, journal = {Journal of Visual Communication and Image Representation}, year = {2018}, volume = {56}, pages = {220--233}, doi = {10.1016/j.jvcir.2018.09.015}, tags = {application}, } -
 F. Gieseke, S. Bloemen, C. Bogaard, T. Heskes, J. Kindler, R. A. Scalzo, V. A. Ribeiro, J. Roestel, P. J. Groot, F. Yuan, A. Möller, and B. E. TuckerJOURNALMonthly Notices of the Royal Astronomical Society (MNRAS) 2017
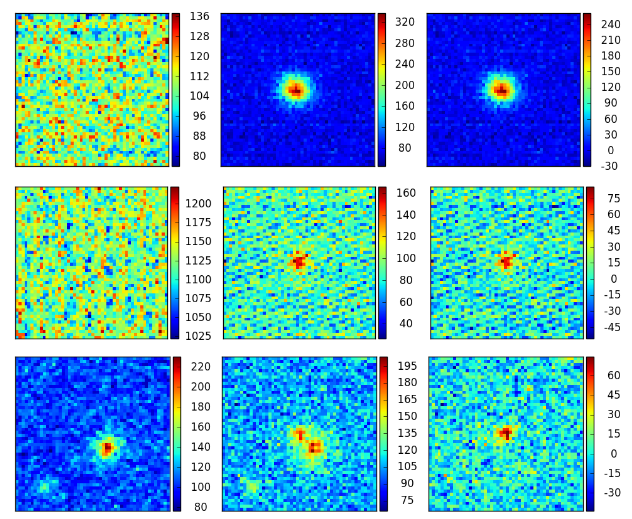
Current synoptic sky surveys monitor large areas of the sky to find variable and transient astronomical sources. As the number of detections per night at a single telescope easily exceeds several thousand, current detection pipelines make intensive use of machine learning algorithms to classify the detected objects and to filter out the most interesting candidates. A number of upcoming surveys will produce up to three orders of magnitude more data, which renders high-precision classification systems essential to reduce the manual and, hence, expensive vetting by human experts. We present an approach based on convolutional neural networks to discriminate between true astrophysical sources and artefacts in reference-subtracted optical images. We show that relatively simple networks are already competitive with state-of-the-art systems and that their quality can further be improved via slightly deeper networks and additional pre-processing steps – eventually yielding models outperforming state-of-the-art systems. In particular, our best model correctly classifies about 97.3 per cent of all ‘real’ and 99.7 per cent of all ‘bogus’ instances on a test set containing 1942 ‘bogus’ and 227 ‘real’ instances in total. Furthermore, the networks considered in this work can also successfully classify these objects at hand without relying on difference images, which might pave the way for future detection pipelines not containing image subtraction steps at all.
@article{GiesekeEtAl2017, author = {Gieseke, Fabian and Bloemen, Steven and van den Bogaard, Cas and Heskes, Tom and Kindler, Jonas and Scalzo, Richard A. and Ribeiro, Valerio A.R.M. and van Roestel, Jan and Groot, Paul J. and Yuan, Fang and Möller, Anais and Tucker, Brad E.}, title = {Convolutional Neural Networks for Transient Candidate Vetting in Large-Scale Surveys}, journal = {Monthly Notices of the Royal Astronomical Society {(MNRAS)}}, year = {2017}, pages = {3101-3114}, volume = {472}, number = {3}, publisher = {Oxford University Press}, tags = {application,ml}, } -
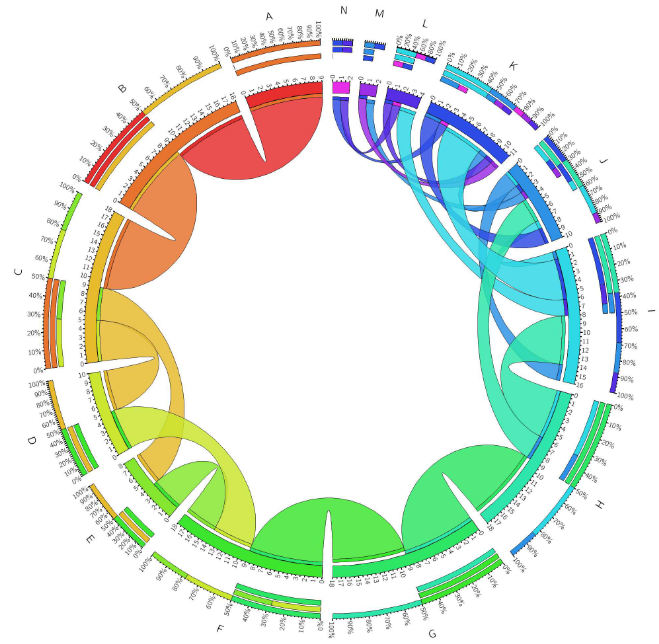
 R. S. Souza, M. L. L. Dantas, M. V. Costa-Duarte, E. D. Feigelson, M. Killedar, P. Lablanche, R. Vilalta, A. Krone-Martins, R. Beck, and F. GiesekeMonthly Notices of the Royal Astronomical Society (MNRAS) 2017
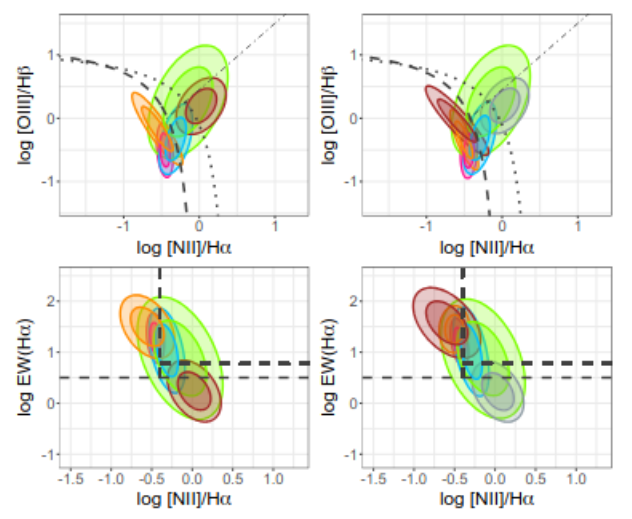
We invoke a Gaussian mixture model (GMM) to jointly analyse two traditional emission-line classification schemes of galaxy ionization sources: the Baldwin-Phillips-Terlevich (BPT) and vs. [NII]/H (WHAN) diagrams, using spectroscopic data from the Sloan Digital Sky Survey Data Release 7 and SEAGal/STARLIGHT datasets. We apply a GMM to empirically define classes of galaxies in a three-dimensional space spanned by the [OIII]/H , [NII]/H , and EW(H ), optical parameters. The best-fit GMM based on several statistical criteria suggests a solution around four Gaussian components (GCs), which are capable to explain up to 97 per cent of the data variance. Using elements of information theory, we compare each GC to their respective astronomical counterpart. GC1 and GC4 are associated with star-forming galaxies, suggesting the need to define a new starburst subgroup. GC2 is associated with BPT’s Active Galaxy Nuclei (AGN) class and WHAN’s weak AGN class. GC3 is associated with BPT’s composite class and WHAN’s strong AGN class. Conversely, there is no statistical evidence – based on four GCs – for the existence of a Seyfert/LINER dichotomy in our sample. Notwithstanding, the inclusion of an additional GC5 unravels it. The GC5 appears associated to the LINER and Passive galaxies on the BPT and WHAN diagrams respectively. Subtleties aside, we demonstrate the potential of our methodology to recover/unravel different objects inside the wilderness of astronomical datasets, without lacking the ability to convey physically interpretable results. The probabilistic classifications from the GMM analysis are publicly available within the COINtoolbox.
@article{SouzaEtAl2017, author = {de Souza, R. S. and Dantas, M. L. L. and Costa-Duarte, M. V. and Feigelson, E. D. and Killedar, M. and Lablanche, P.-Y. and Vilalta, R. and Krone-Martins, A. and Beck, R. and Gieseke, Fabian}, title = {A probabilistic approach to emission-line galaxy classification}, journal = {Monthly Notices of the Royal Astronomical Society {(MNRAS)}}, year = {2017}, publisher = {Oxford University Press}, tags = {application} } -
 J. Kremer, K. Stensbo-Smidt, F. Gieseke, K. S. Pedersen, and C. IgelIEEE Intelligent Systems 2017
Astrophysics and cosmology are rich with data. The advent of wide-area digital cameras on large aperture telescopes has led to ever more ambitious surveys of the sky. Data volumes of entire surveys a decade ago can now be acquired in a single night and real-time analysis is often desired. Thus, modern astronomy requires big data know-how, in particular it demands highly efficient machine learning and image analysis algorithms. But scalability is not the only challenge: Astronomy applications touch several current machine learning research questions, such as learning from biased data and dealing with label and measurement noise. We argue that this makes astronomy a great domain for computer science research, as it pushes the boundaries of data analysis. In the following, we will present this exciting application area for data scientists. We will focus on exemplary results, discuss main challenges, and highlight some recent methodological advancements in machine learning and image analysis triggered by astronomical applications.
@article{KremerSGPI17, author = {Kremer, Jan and Stensbo{-}Smidt, Kristoffer and Gieseke, Fabian and Pedersen, Kim Steenstrup and Igel, Christian}, title = {Big Universe, Big Data: Machine Learning and Image Analysis for Astronomy}, journal = {{IEEE} Intelligent Systems}, volume = {32}, number = {2}, pages = {16--22}, year = {2017}, doi = {10.1109/MIS.2017.40}, tags = {application}, } -
 A. Mahabal, K. Sheth, F. Gieseke, A. Pai, S. G. Djorgovski, A. J. Drake, and M. J. Graham2017 IEEE Symposium Series on Computational Intelligence, SSCI 2017, Honolulu, HI, USA, November 27 - Dec. 1, 2017 2017
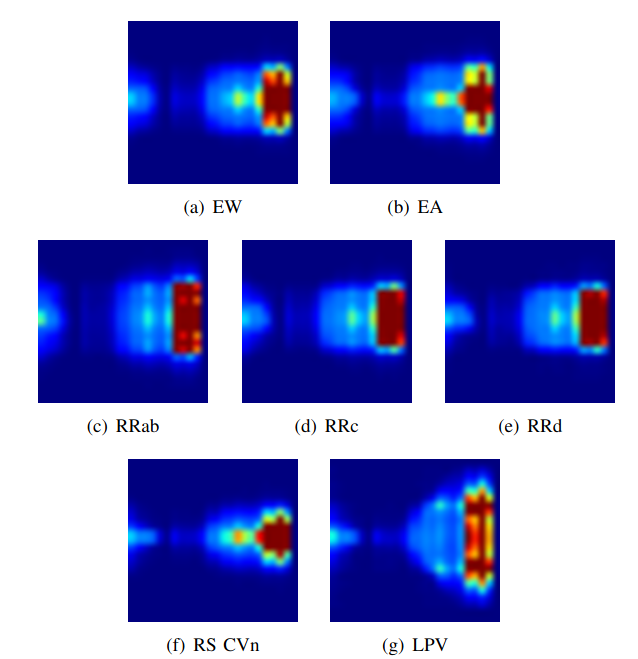
Astronomy light curves are sparse, gappy, and heteroscedastic. As a result standard time series methods regularly used for financial and similar datasets are of little help and astronomers are usually left to their own instruments and techniques to classify light curves. A common approach is to derive statistical features from the time series and to use machine learning methods, generally supervised, to separate objects into a few of the standard classes. In this work, we transform the time series to two-dimensional light curve representations in order to classify them using modern deep learning techniques. In particular, we show that convolutional neural networks based classifiers work well for broad characterization and classification. We use labeled datasets of periodic variables from CRTS survey and show how this opens doors for a quick classification of diverse classes with several possible exciting extensions.
@inproceedings{MahabalSGPDDG17, author = {Mahabal, Ashish and Sheth, Kshiteej and Gieseke, Fabian and Pai, A. and Djorgovski, S. George and Drake, Andrew J. and Graham, Matthew J.}, title = {Deep-learnt classification of light curves}, booktitle = {2017 {IEEE} Symposium Series on Computational Intelligence, {SSCI} 2017, Honolulu, HI, USA, November 27 - Dec. 1, 2017}, pages = {1--8}, publisher = {{IEEE}}, year = {2017}, doi = {10.1109/SSCI.2017.8280984}, tags = {application}, } -
 C. Florea, C. Toca, and F. Gieseke2017 IEEE Winter Conference on Applications of Computer Vision, WACV 2017, Santa Rosa, CA, USA, March 24-31, 2017 2017
We address the problem of automatically recognizing artistic movement in digitized paintings. We make the fol- lowing contributions: Firstly, we introduce a large digitized painting database that contains refined annotations of artis- tic movement. Secondly, we propose a new system for the automatic categorization that resorts to image descriptions by color structure and novel topographical features as well as to an adapted boosted ensemble of support vector ma- chines. The system manages to isolate initially misclassi- fied images and to correct such errors in further stages of the boosting process. The resulting performance of the sys- tem compares favorably with classical solutions in terms of accuracy and even manages to outperform modern deep learning frameworks.
@inproceedings{FloreaTG17, author = {Florea, Corneliu and Toca, Cosmin and Gieseke, Fabian}, title = {Artistic Movement Recognition by Boosted Fusion of Color Structure and Topographic Description}, booktitle = {2017 {IEEE} Winter Conference on Applications of Computer Vision, {WACV} 2017, Santa Rosa, CA, USA, March 24-31, 2017}, pages = {569--577}, publisher = {{IEEE} Computer Society}, year = {2017}, doi = {10.1109/WACV.2017.69}, tags = {application}, } -
 R. Beck, C. A. Lin, E. O. Ishida, F. Gieseke, R. S. Souza, M. V. Costa-Duarte, M. W. Hattab, and A. Krone-MartinsMonthly Notices of the Royal Astronomical Society (MNRAS) 2017
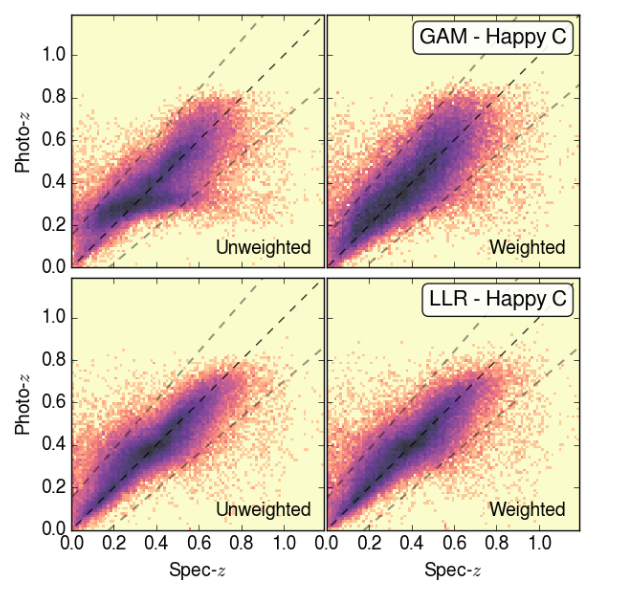
Two of the main problems encountered in the development and accurate validation of photometric redshift (photo-z) techniques are the lack of spectroscopic coverage in feature space (e.g. colours and magnitudes) and the mismatch between photometric error distributions associated with the spectroscopic and photometric samples. Although these issues are well known, there is currently no standard benchmark allowing a quantitative analysis of their impact on the final photo-z estimation. In this work, we present two galaxy catalogues, Teddy and Happy, built to enable a more demanding and realistic test of photo-z methods. Using photometry from the Sloan Digital Sky Survey and spectroscopy from a collection of sources, we constructed datasets which mimic the biases between the underlying probability distribution of the real spectroscopic and photometric sample. We demonstrate the potential of these catalogues by submitting them to the scrutiny of different photo-z methods, including machine learning (ML) and template fitting approaches. Beyond the expected bad results from most ML algorithms for cases with missing coverage in feature space, we were able to recognize the superiority of global models in the same situation and the general failure across all types of methods when incomplete coverage is convoluted with the presence of photometric errors - a data situation which photo-z methods were not trained to deal with up to now and which must be addressed by future large scale surveys. Our catalogues represent the first controlled environment allowing a straightforward implementation of such tests.
@article{BeckEtAl2017, author = {Beck, Robert and Lin, Chieh A. and Ishida, Emille O. and Gieseke, Fabian and de Souza, Rafel S. and Costa-Duarte, Marcus V. and Hattab, Mohammed W. and Krone-Martins, Alberto}, title = {On the realistic validation of photometric redshifts}, journal = {Monthly Notices of the Royal Astronomical Society {(MNRAS)}}, year = {2017}, volume = {468}, number = {4}, pages = {4323-4339}, publisher = {Oxford University Press}, tags = {application}, } -
 K. Stensbo-Smidt, F. Gieseke, A. Zirm, K. S. Pedersen, and C. IgelMonthly Notices of the Royal Astronomical Society (MNRAS) 2017
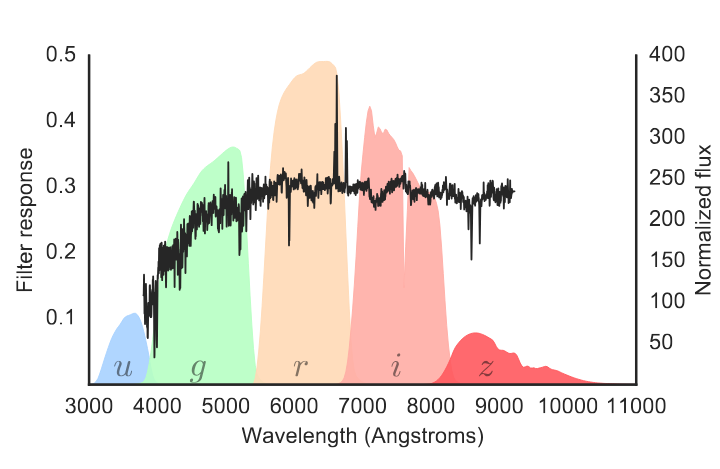
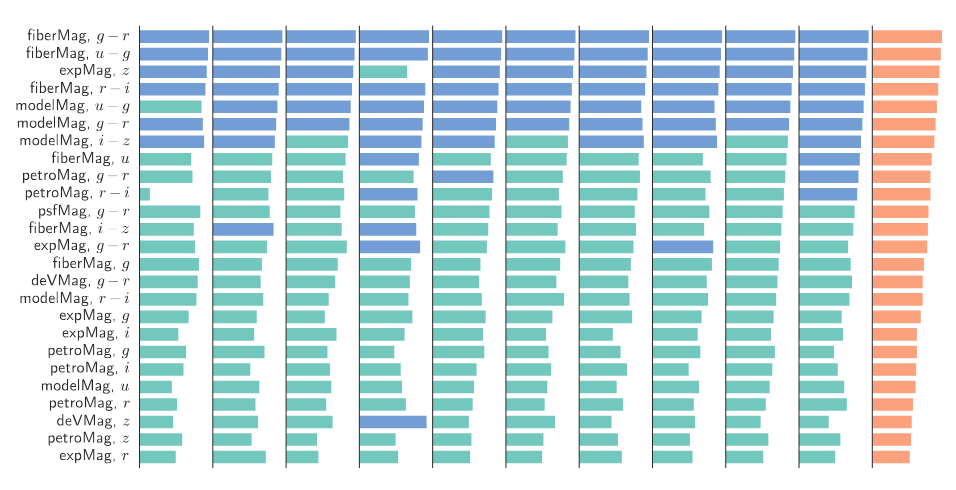
Large-scale surveys make huge amounts of photometric data available. Because of the sheer amount of objects, spectral data cannot be obtained for all of them. Therefore it is important to devise techniques for reliably estimating physical properties of objects from photometric information alone. These estimates are needed to automatically identify interesting objects worth a follow-up investigation as well as to produce the required data for a statistical analysis of the space covered by a survey. We argue that machine learning techniques are suitable to compute these estimates accurately and efficiently. This study promotes a feature selection algorithm, which selects the most informative magnitudes and colours for a given task of estimating physical quantities from photometric data alone. Using k nearest neighbours regression, a well-known non-parametric machine learning method, we show that using the found features significantly increases the accuracy of the estimations compared to using standard features and standard methods. We illustrate the usefulness of the approach by estimating specific star formation rates (sSFRs) and redshifts (photo-z’s) using only the broad-band photometry from the Sloan Digital Sky Survey (SDSS). For estimating sSFRs, we demonstrate that our method produces better estimates than traditional spectral energy distribution (SED) fitting. For estimating photo-z’s, we show that our method produces more accurate photo-z’s than the method employed by SDSS. The study highlights the general importance of performing proper model selection to improve the results of machine learning systems and how feature selection can provide insights into the predictive relevance of particular input features.
@article{StensboSmidt2016, author = {Stensbo-Smidt, Kristoffer and Gieseke, Fabian and Zirm, Andrew and Pedersen, Kim Steenstrup and Igel, Christian}, title = {Sacrificing information for the greater good: how to select photometric bands for optimal accuracy}, journal = {Monthly Notices of the Royal Astronomical Society {(MNRAS)}}, year = {2017}, volume = {464}, number = {3}, pages = {2577-2596}, publisher = {Oxford University Press}, tags = {application}, } -
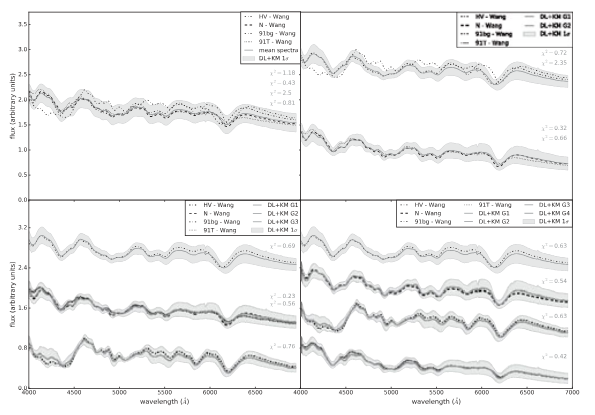
 M. Sasdelli, E. O. Ishida, R. Vilalta, M. Aguena, V. C. Busti, H. Camacho, A. M. M. Trindade, F. Gieseke, R. S. Souza, Y. T. Fantaye, and P. A. MazzaliMonthly Notices of the Royal Astronomical Society (MNRAS) 2016
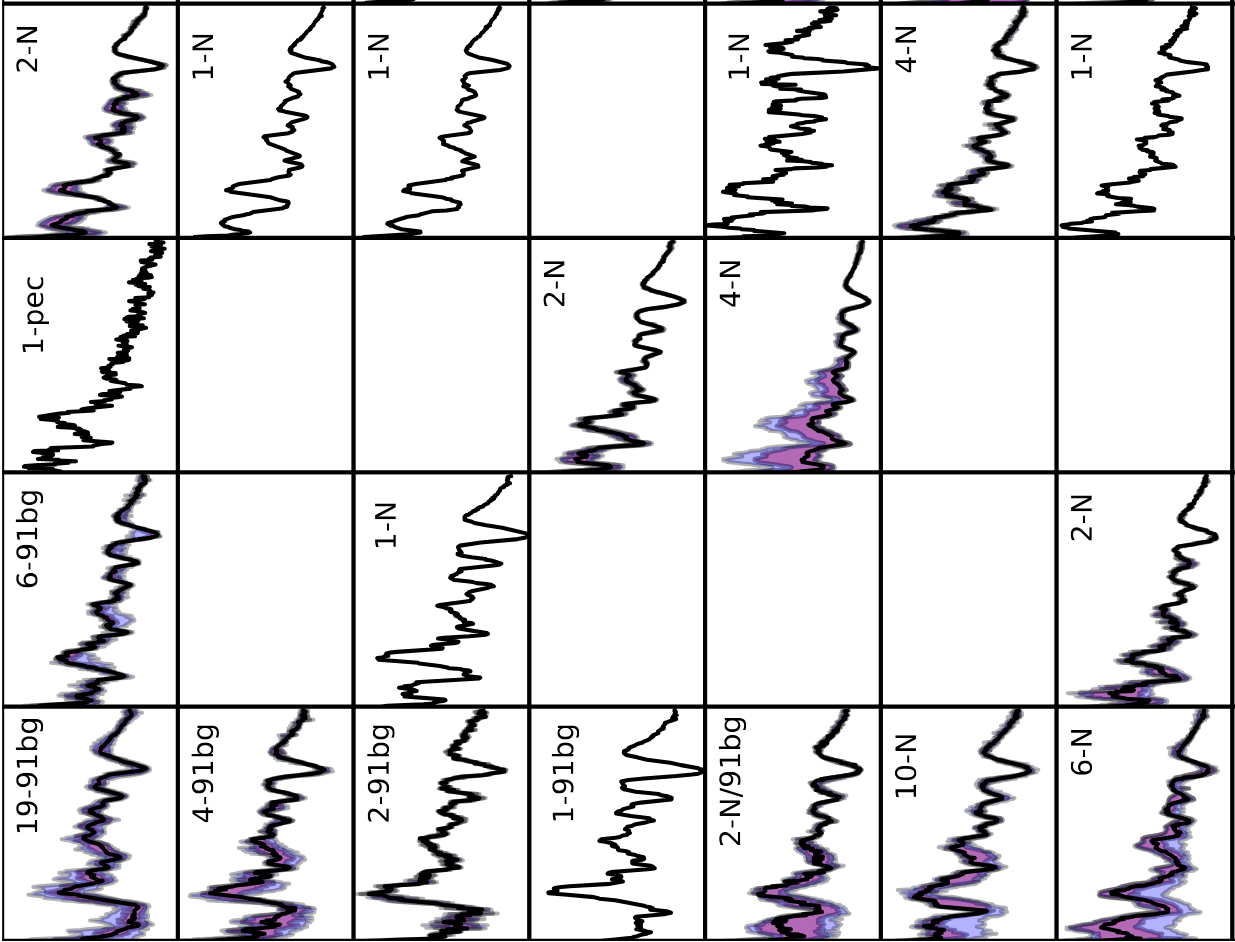
The existence of multiple subclasses of Type Ia supernovae (SNe Ia) has been the subject of great debate in the last decade. One major challenge inevitably met when trying to infer the existence of one or more subclasses is the time consuming, and subjective, process of subclass definition. In this work, we show how machine learning tools facilitate identification of subtypes of SNe Ia through the establishment of a hierarchical group structure in the continuous space of spectral diversity formed by these objects. Using deep learning, we were capable of performing such identification in a four-dimensional feature space (+1 for time evolution), while the standard principal component analysis barely achieves similar results using 15 principal components. This is evidence that the progenitor system and the explosion mechanism can be described by a small number of initial physical parameters. As a proof of concept, we show that our results are in close agreement with a previously suggested classification scheme and that our proposed method can grasp the main spectral features behind the definition of such subtypes. This allows the confirmation of the velocity of lines as a first-order effect in the determination of SN Ia subtypes, followed by 91bg-like events. Given the expected data deluge in the forthcoming years, our proposed approach is essential to allow a quick and statistically coherent identification of SNe Ia subtypes (and outliers). All tools used in this work were made publicly available in the python package Dimensionality Reduction And Clustering for Unsupervised Learning in Astronomy (dracula) and can be found within COINtoolbox (https://github.com/COINtoolbox/DRACULA).
@article{Sasdelli2016, author = {Sasdelli, Michele and Ishida, E. O. and Vilalta, R. and Aguena, M. and Busti, V. C. and Camacho, H. and Trindade, A. M. M. and Gieseke, Fabian and de Souza, R. S. and Fantaye, Y. T. and Mazzali, P. A.}, title = {Exploring the spectroscopic diversity of type Ia supernovae with {DRACULA}: {A} machine learning approach}, journal = {Monthly Notices of the Royal Astronomical Society (MNRAS)}, year = {2016}, volume = {461}, number = {2}, pages = {2044-2059}, publisher = {Oxford University Press}, tags = {application}, } -
 E. E. O. Ishida, M. Sasdelli, R. Vilalta, M. Aguena, V. C. Busti, H. Camacho, A. M. M. Trindade, F. Gieseke, R. S. Souza, Y. T. Fantaye, and P. A. MazzaliAstroinformatics 2016, Sorrento, Italy, October 19-25, 2016 2016
The existence of multiple subclasses of type Ia supernovae (SNeIa) has been the subject of great debate in the last decade. In this work, we show how machine learning tools facilitate identification of subtypes of SNe Ia. Using Deep Learning for dimensionality reduction, we were capable of performing such identification in a parameter space of significantly lower dimension than its principal component analysis counterpart. This is evidence that the progenitor system and the explosion mechanism can be described with a small number of initial physical parameters. All tools used here are publicly available in the Python package DRACULA (Dimensionality Reduction And Clustering for Unsupervised Learning in Astronomy) and can be found within COINtoolbox (https://github.com/COINtoolbox/DRACULA).
@inproceedings{IshidaSVABCTGSF16, author = {Ishida, Emille E. O. and Sasdelli, Michele and Vilalta, Ricardo and Aguena, Michel and Busti, Vinicius C. and Camacho, Hugo and Trindade, Arlindo M. M. and Gieseke, Fabian and de Souza, Rafael S. and Fantaye, Yabebal T. and Mazzali, Paolo A.}, editor = {Brescia, Massimo and Djorgovski, S. George and Feigelson, Eric D. and Longo, Giuseppe and Cavuoti, Stefano}, title = {Exploring the spectroscopic diversity of type Ia supernovae with Deep Learning and Unsupervised Clustering}, booktitle = {Astroinformatics 2016, Sorrento, Italy, October 19-25, 2016}, series = {Proceedings of the International Astronomical Union}, volume = {12}, number = {{S325}}, pages = {247--252}, publisher = {Cambridge University Press}, year = {2016}, tags = {application}, } -
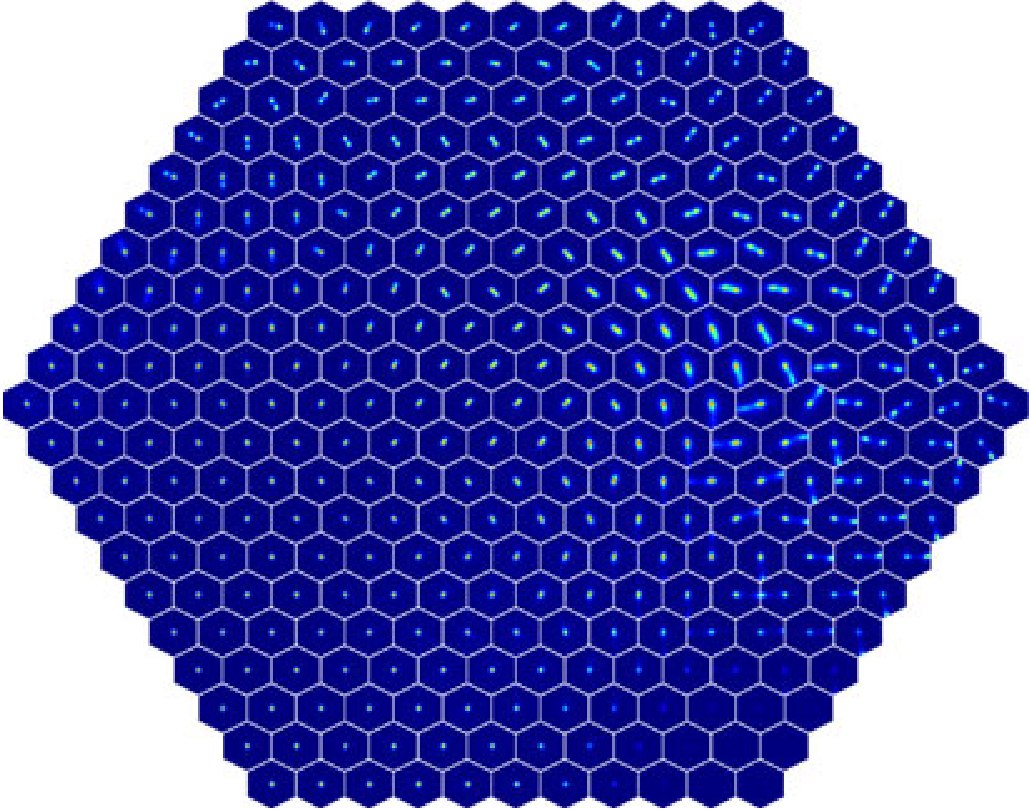 K. L. Polsterer, F. Gieseke, C. Igel, B. Doser, and N. Gianniotis24th European Symposium on Artificial Neural Networks, ESANN 2016, Bruges, Belgium, April 27-29, 2016 2016
@inproceedings{PolstererGIDG16, author = {Polsterer, Kai Lars and Gieseke, Fabian and Igel, Christian and Doser, Bernd and Gianniotis, Nikolaos}, title = {Parallelized rotation and flipping INvariant Kohonen maps {(PINK)} on GPUs}, booktitle = {24th European Symposium on Artificial Neural Networks, {ESANN} 2016, Bruges, Belgium, April 27-29, 2016}, year = {2016}, tags = {de,application,hpc}, } -
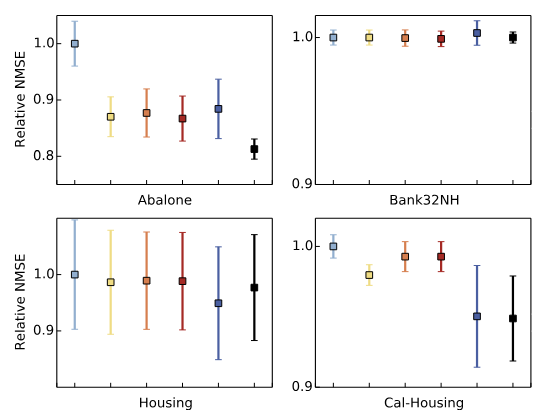 J. Kremer, F. Gieseke, K. S. Pedersen, and C. IgelAstronomy and Computing 2015
In astronomical applications of machine learning, the distribution of objects used for building a model is often different from the distribution of the objects the model is later applied to. This is known as sample selection bias, which is a major challenge for statistical inference as one can no longer assume that the labeled training data are representative. To address this issue, one can re-weight the labeled training patterns to match the distribution of unlabeled data that are available already in the training phase. There are many examples in practice where this strategy yielded good results, but estimating the weights reliably from a finite sample is challenging. We consider an efficient nearest neighbor density ratio estimator that can exploit large samples to increase the accuracy of the weight estimates. To solve the problem of choosing the right neighborhood size, we propose to use cross-validation on a model selection criterion that is unbiased under covariate shift. The resulting algorithm is our method of choice for density ratio estimation when the feature space dimensionality is small and sample sizes are large. The approach is simple and, because of the model selection, robust. We empirically find that it is on a par with established kernel-based methods on relatively small regression benchmark datasets. However, when applied to large-scale photometric redshift estimation, our approach outperforms the state-of-the-art.
@article{KremerGPI2015, author = {Kremer, Jan and Gieseke, Fabian and Pedersen, Kim Steenstrup and Igel, Christian}, title = {Nearest Neighbor Density Ratio Estimation for Large-Scale Applications in Astronomy}, journal = {Astronomy and Computing}, volume = {12}, pages = {62--72}, year = {2015}, tags = {application} } -
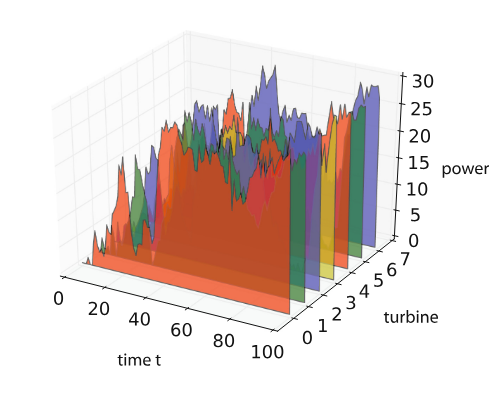 O. Kramer, F. Gieseke, J. Heinermann, J. Poloczek, and N. A. TreiberData Analytics for Renewable Energy Integration - Second ECML PKDD Workshop, DARE 2014, Nancy, France, September 19, 2014, Revised Selected Papers 2014
Wind energy is playing an increasingly important part for ecologically friendly power supply. The fast growing infrastructure of wind turbines can be seen as large sensor system that screens the wind energy at a high temporal and spatial resolution. The resulting data- bases consist of huge amounts of wind energy time series data that can be used for prediction, controlling, and planning purposes. In this work, we describe WindML, a Python-based framework for wind energy related machine learning approaches. The main objective of WindML is the continuous development of tools that address important challenges induced by the growing wind energy information infrastructures. Various examples that demonstrate typical use cases are introduced and related research questions are discussed. The different modules of WindML reach from standard machine learning algorithms to advanced techniques for handling missing data and monitoring high-dimensional time series.
@inproceedings{KramerGHPT14, author = {Kramer, Oliver and Gieseke, Fabian and Heinermann, Justin and Poloczek, Jendrik and Treiber, Nils Andr{\'{e}}}, editor = {Woon, Wei Lee and Aung, Zeyar and Madnick, Stuart E.}, title = {A Framework for Data Mining in Wind Power Time Series}, booktitle = {Data Analytics for Renewable Energy Integration - Second {ECML} {PKDD} Workshop, {DARE} 2014, Nancy, France, September 19, 2014, Revised Selected Papers}, series = {Lecture Notes in Computer Science}, volume = {8817}, pages = {97--107}, publisher = {Springer}, year = {2014}, doi = {10.1007/978-3-319-13290-7\_8}, tags = {application,energy}, } -
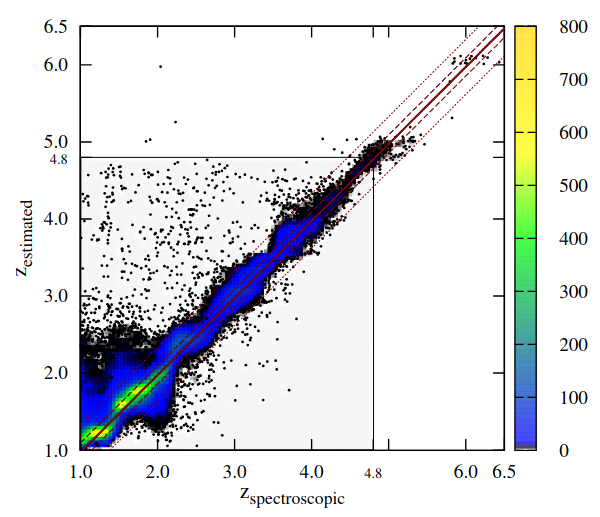 K. L. Polsterer, P. Zinn, and F. GiesekeMonthly Notices of the Royal Astronomical Society (MNRAS) 2013
Quasars with a high redshift (z) are important to understand the evolution processes of galaxies in the early Universe. However, only a few of these distant objects are known to this date. The costs of building and operating a 10-m class telescope limit the number of facilities and, thus, the available observation time. Therefore, an efficient selection of candidates is mandatory. This paper presents a new approach to select quasar candidates with high redshift (z > 4.8) based on photometric catalogues. We have chosen to use the z > 4.8 limit for our approach because the dominant Lyman α emission line of a quasar can only be found in the Sloan i- and z-band filters. As part of the candidate selection approach, a photometric redshift estimator is presented, too. Three of the 120 000 generated candidates have been spectroscopically analysed in follow-up observations and a new z = 5.0 quasar was found. This result is consistent with the estimated detection ratio of about 50 per cent and we expect 60 000 high-redshift quasars to be part of our candidate sample. The created candidates are available for download at MNRAS or at http://www.astro.rub.de/polsterer/quasar-candidates.csv.
@article{PolstererZG2013, author = {Polsterer, Kai Lars and Zinn, Peter and Gieseke, Fabian}, title = {Finding New High-Redshift Quasars by Asking the Neighbours}, journal = {Monthly Notices of the Royal Astronomical Society (MNRAS)}, year = {2013}, volume = {428}, number = {1}, pages = {226-235}, publisher = {Oxford University Press}, tags = {application}, } -
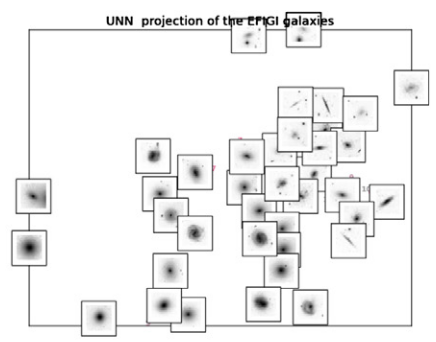 O. Kramer, F. Gieseke, and K. L. PolstererExpert Systems with Applications 2013
Hubble’s morphological classification of galaxies has found broad acceptance in astronomy since decades. Numerous extensions have been proposed in the past, mostly based on galaxy prototypes. In this work, we automatically learn morphological maps of galaxies with unsupervised machine learning methods that preserve neighborhood relations and data space distances. For this sake, we focus on a stochastic variant of unsupervised nearest neighbors (UNN) for arranging galaxy prototypes on a two-dimensional map. UNN regression is the unsupervised counterpart of nearest neighbor regression for dimensionally reduction. In the experimental part of this article, we visualize the embeddings and compare the learning results achieved by various UNN parameterizations and related dimensionality reduction methods.
@article{KramerGP13, author = {Kramer, Oliver and Gieseke, Fabian and Polsterer, Kai Lars}, title = {Learning morphological maps of galaxies with unsupervised regression}, journal = {Expert Systems with Applications}, volume = {40}, number = {8}, pages = {2841--2844}, year = {2013}, doi = {10.1016/j.eswa.2012.12.002}, tags = {application}, } -
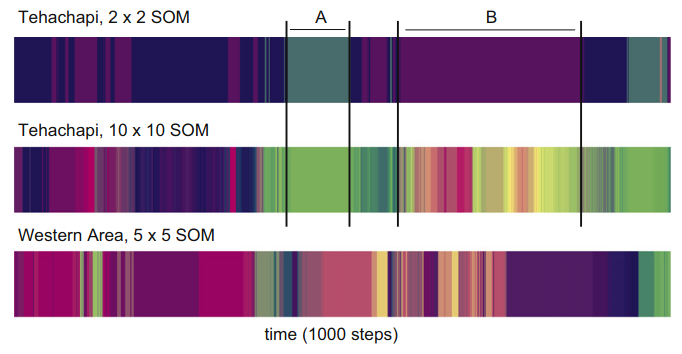 O. Kramer, F. Gieseke, and B. SatzgerNeurocomputing 2013
Wind energy has an important part to play as renewable energy resource in a sustainable world. For a reliable integration of wind energy high-dimensional wind time-series have to be analyzed. Fault analysis and prediction are an important aspect in this context. The objective of this work is to show how methods from neural computation can serve as forecasting and monitoring techniques, contribut- ing to a successful integration of wind into sustainable and smart energy grids. We will employ support vector regression as prediction method for wind energy time-series. Furthermore, we will use dimension reduction techniques like self-organizing maps for monitoring of high-dimensional wind time-series. The methods are briefly introduced, related work is presented, and experimental case studies are exemplarily described. The experimental parts are based on real wind energy time-series data from the National Renewable Energy Laboratory (NREL) western wind resource data set
@article{KramerGS13, author = {Kramer, Oliver and Gieseke, Fabian and Satzger, Benjamin}, title = {Wind energy prediction and monitoring with neural computation}, journal = {Neurocomputing}, volume = {109}, pages = {84--93}, year = {2013}, doi = {10.1016/j.neucom.2012.07.029}, tags = {energy,application}, } -
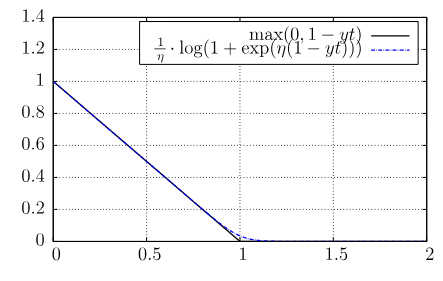 F. GiesekeKI 2013
Support vector machines are among the most popular techniques in machine learning. Given sufficient la- beled data, they often yield excellent results. However, for a variety of real-world tasks, the acquisition of sufficient la- beled data can be very time-consuming; unlabeled data, on the other hand, can often be obtained easily in huge quan- tities. Semi-supervised support vector machines try to take advantage of these additional unlabeled patterns and have been successfully applied in this context. However, they induce a hard combinatorial optimization problem. In this work, we present two optimization strategies that address this task and evaluate the potential of the resulting imple- mentations on real-world data sets, including an example from the field of astronomy.
@article{Gieseke13, author = {Gieseke, Fabian}, title = {From Supervised to Unsupervised Support Vector Machines and Applications in Astronomy}, journal = {{KI}}, volume = {27}, number = {3}, pages = {281--285}, year = {2013}, doi = {10.1007/s13218-013-0248-1}, tags = {ml,de,application}, } -
 F. GiesekeAusgezeichnete Informatikdissertationen 2012 2012
Ein bekanntes Problem des maschinellen Lernens ist die Klassifikation von Objekten. Entsprechende Modelle basieren dabei meist auf Trainingsdaten, welche aus Mustern mit zugehörigen Labeln bestehen. Die Erstellung eines hinreichend großen Datensatzes kann sich für gewisse Anwendungsfälle jedoch als sehr kosten- oder zeitintensiv erweisen. Eine aktuelle Forschungsrichtung des maschinellen Lernens zielt auf die Verwendung von (zusätzlichen) ungelabelten Mustern ab, welche oft ohne großen Aufwand gewonnen werden können. In diesem Beitrag wird die Erweiterung von sogenannten Support-Vektor-Maschinen auf solche Lernszenarien beschrieben. Im Gegensatz zu Support-Vektor-Maschinen führen diese Varianten jedoch zu kombinatorischen Optimierungsproblemen. Die Entwicklung effizienter Optimierungsstrategien ist daher ein erstrebenswertes Ziel und soll im Rahmen dieses Beitrags diskutiert werden. Weiterhin werden mögliche Anwendungsgebiete der entsprechenden Verfahren erläutert, welche sich unter anderem im Bereich der Astronomie wiederfinden.
@inproceedings{Gieseke12, author = {Gieseke, Fabian}, editor = {H{\"{o}}lldobler, Steffen}, title = {Von {\"{u}}berwachten zu un{\"{u}}berwachten Support-Vektor-Maschinen und Anwendungen in der Astronomie}, booktitle = {Ausgezeichnete Informatikdissertationen 2012}, series = {{LNI}}, volume = {{D-13}}, pages = {111--120}, publisher = {{GI}}, year = {2012}, tags = {ml,de,application}, } -
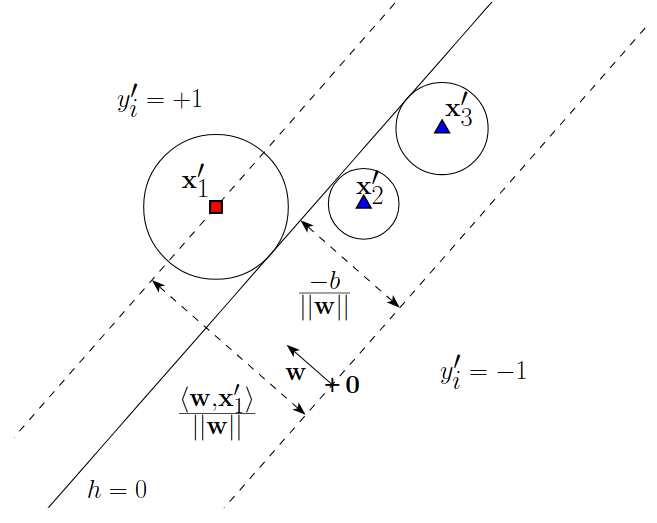 F. Giesekethesis Carl von Ossietzky University of Oldenburg 2011
A common task in the field of machine learning is the classification of objects. The basis for such a task is usually a training set consisting of patterns and associated class labels. A typical example is, for instance, the automatic classification of stars and galaxies in the field of astronomy. Here, the training set could consist of images and associated labels, which indicate whether a particular image shows a star or a galaxy. For such a learning scenario, one aims at generating models that can automatically classify new, unseen images. In the field of machine learning, various classification schemes have been proposed. One of the most popular ones is the concept of support vector machines, which often yields excellent classification results given sufficient labeled data. However, for a variety of real-world tasks, the acquisition of sufficient labeled data can be quite time-consuming. In contrast to labeled training data, unlabeled one can often be obtained easily in huge quantities. Semi- and unsupervised techniques aim at taking these unlabeled patterns into account to generate appropriate models. In the literature, various ways of extending support vector machines to these scenarios have been proposed. One of these ways leads to combinatorial optimization tasks that are difficult to address. In this thesis, several optimization strategies will be developed for these tasks that (1) aim at solving them exactly or (2) aim at obtaining (possibly suboptimal) candidate solutions in an efficient kind of way. More specifically, we will derive a polynomial-time approach that can compute exact solutions for special cases of both tasks. This approach is among the first ones that provide upper runtime bounds for the tasks at hand and, thus, yield theoretical insights into their computational complexity. In addition to this exact scheme, two heuristics tackling both problems will be provided. The first one is based on least-squares variants of the original tasks whereas the second one relies on differentiable surrogates for the corresponding objective functions. While direct implementations of both heuristics are still computationally expensive, we will show how to make use of matrix operations to speed up their execution. This will result in two optimization schemes that exhibit an excellent classification and runtime performance. Despite these theoretical derivations, we will also depict possible application domains of machine learning methods in astronomy. Here, the massive amount of data given for today’s and future projects renders a manual analysis impossible and necessitates the use of sophisticated techniques. In this context, we will derive an efficient way to preprocess spectroscopic data, which is based on an adaptation of support vector machines, and the benefits of semi-supervised learning schemes for appropriate learning tasks will be sketched. As a further contribution to this field, we will propose the use of so-called resilient algorithms for the automatic data analysis taking place aboard today’s spacecrafts and will demonstrate their benefits in the context of clustering hyperspectral image data.
@phdthesis{Gieseke2011, author = {Gieseke, Fabian}, title = {From supervised to unsupervised support vector machines and applications in astronomy}, school = {Carl von Ossietzky University of Oldenburg}, year = {2011}, tags = {ml,de,application} } -
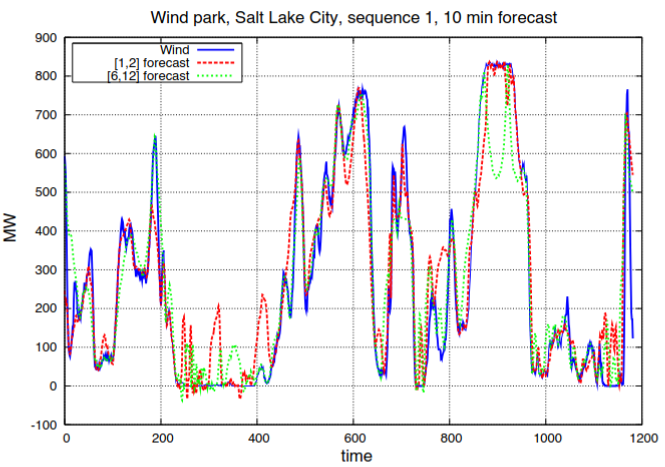 O. Kramer, and F. GiesekeSeventh International Conference on Natural Computation, ICNC 2011, Shanghai, China, 26-28 July, 2011 2011
Wind energy has an important part to play as renewable energy resource in a sustainable world. For a reliable integration of wind energy the volatile nature of wind has to be understood. This article shows how kernel methods and neural networks can serve as modeling, forecasting and monitoring techniques, and, how they contribute to a successful integration of wind into smart energy grids. First, we will employ kernel density estimation for modeling of wind data. Kernel density estimation allows a statistically sound modeling of time series data. The corresponding experiments are based on real data of wind energy time series from the NREL western wind resource dataset. Second, we will show how prediction of wind energy can be accomplished with the help of support vector regression. Last, we will use self-organizing feature maps to map high-dimensional wind time series to colored sequences that can be used for error detection.
@inproceedings{KramerG11, author = {Kramer, Oliver and Gieseke, Fabian}, editor = {Ding, Yongsheng and Wang, Haiying and Xiong, Ning and Hao, Kuangrong and Wang, Lipo}, title = {Analysis of wind energy time series with kernel methods and neural networks}, booktitle = {Seventh International Conference on Natural Computation, {ICNC} 2011, Shanghai, China, 26-28 July, 2011}, pages = {2381--2385}, publisher = {{IEEE}}, year = {2011}, doi = {10.1109/ICNC.2011.6022597}, tags = {application,energy} } -
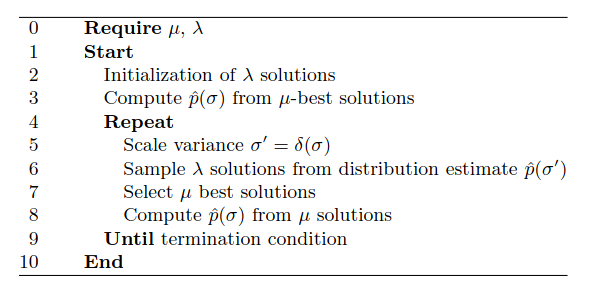 O. Kramer, and F. GiesekeKI 2011: Advances in Artificial Intelligence, 34th Annual German Conference on AI, Berlin, Germany, October 4-7,2011. Proceedings 2011
Estimation of distribution algorithms (EDAs) are derivative-free optimization approaches based on the successive estimation of the probability density function of the best solutions, and their subsequent sampling. It turns out that the success of EDAs in numerical optimization strongly depends on scaling of the variance. The contribution of this paper is a comparison of various adaptive and self-adaptive variance scaling techniques for a Gaussian EDA. The analysis includes: (1) the Gaussian EDA without scaling, but different selection pressures and population sizes, (2) the variance adaptation technique known as Silverman’s rule-of-thumb, (3) σ-self-adaptation known from evolution strategies, and (4) transformation of the solution space by estimation of the Hessian. We discuss the results for the sphere function, and its constrained counterpart.
@inproceedings{Kramer2011, author = {Kramer, Oliver and Gieseke, Fabian}, title = {Variance Scaling for EDAs Revisited}, booktitle = {{KI} 2011: Advances in Artificial Intelligence, 34th Annual German Conference on AI, Berlin, Germany, October 4-7,2011. Proceedings}, year = {2011}, editor = {Bach, Joscha and Edelkamp, Stefan}, volume = {7006}, series = {Lecture Notes in Computer Science}, pages = {169--178}, publisher = {Springer}, doi = {10.1007/978-3-642-24455-1\_16}, tags = {application}, } -
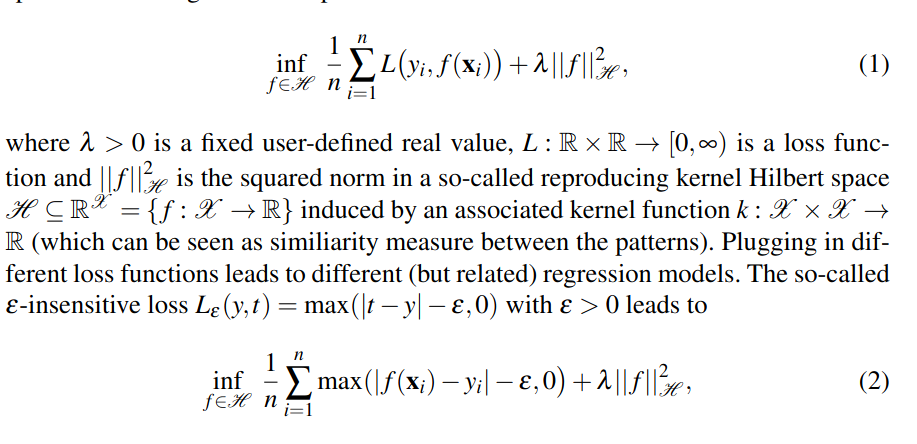 O. Kramer, and F. GiesekeSoft Computing Models in Industrial and Environmental Applications, 6th International Conference SOCO 2011, 6-8 April, 2011, Salamanca, Spain 2011
Wind energy prediction has an important part to play in a smart energy grid for load balancing and capacity planning. In this paper we explore, if wind measurements based on the existing infrastructure of windmills in neighbored wind parks can be learned with a soft computing approach for wind energy prediction in the ten-minute to six-hour range. For this sake we employ Support Vector Regression (SVR) for time series forecasting, and run experimental analyses on real-world wind data from the NREL western wind resource dataset. In the experimental part of the paper we concentrate on loss function parameterization of SVR. We try to answer how far ahead a reliable wind forecast is possible, and how much information from the past is necessary.We demonstrate the capabilities of SVR-based wind energy forecast on the micro-scale level of one wind grid point, and on the larger scale of a whole wind park.
@inproceedings{Kramer2011a, author = {Kramer, Oliver and Gieseke, Fabian}, title = {Short-Term Wind Energy Forecasting Using Support Vector Regression}, booktitle = {Soft Computing Models in Industrial and Environmental Applications, 6th International Conference {SOCO} 2011, 6-8 April, 2011, Salamanca, Spain}, year = {2011}, editor = {Corchado, Emilio and Sn{\'{a}}sel, V{\'{a}}clav and Sedano, Javier and Hassanien, Aboul Ella and Calvo{-}Rolle, Jos{\'{e}} Lu{\'{\i}}s and Slezak, Dominik}, volume = {87}, series = {Advances in Intelligent and Soft Computing}, pages = {271--280}, publisher = {Springer}, doi = {10.1007/978-3-642-19644-7\_29}, tags = {application,energy}, } -
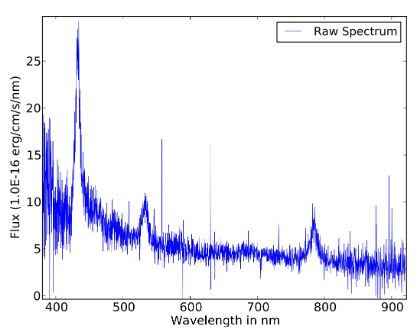 F. Gieseke, K. L. Polsterer, A. Thom, P. Zinn, D. Bomanns, R. Dettmar, O. Kramer, and J. VahrenholdThe Ninth International Conference on Machine Learning and Applications, ICMLA 2010, Washington, DC, USA, 12-14 December 2010 2010
We present a classification-based approach to identify quasi-stellar radio sources (quasars) in the Sloan Digital Sky Survey and evaluate its performance on a manually labeled training set. While reasonable results can already be obtained via approaches working only on photometric data, our experiments indicate that simple but problem-specific features extracted from spectroscopic data can significantly improve the classification performance. Since our approach works orthogonal to existing classification schemes used for building the spectroscopic catalogs, our classification results are well suited for a mutual assessment of the approaches’ accuracies.
@inproceedings{GiesekePTZBDKV10,
  author = {Gieseke, Fabian and Polsterer, Kai Lars and Thom, Andreas and Zinn, Peter and Bomanns, Dominik and Dettmar, Ralf{-}Jurgen and Kramer, Oliver and Vahrenhold, Jan},
  editor = {Draghici, Sorin and Khoshgoftaar, Taghi M. and Palade, Vasile and Pedrycz, Witold and Wani, M. Arif and Zhu, Xingquan},
  title = {Detecting Quasars in Large-Scale Astronomical Surveys},
  booktitle = {The Ninth International Conference on Machine Learning and Applications,
                 {ICMLA} 2010, Washington, DC, USA, 12-14 December 2010},
  pages = {352--357},
  publisher = {{IEEE} Computer Society},
  year = {2010},
  url = {https://doi.org/10.1109/ICMLA.2010.59},
  doi = {10.1109/ICMLA.2010.59},
  tags = {application},
}


